Content decay — where web page traffic or keyword rankings reach a peak and begin to decrease over time — is a topic that’s growing in popularity in the digital marketing community.
Tracking content decay particularly matters for eCommerce companies because when it’s happening to your most important or highest-converting pages, it can tie directly to losses in revenue. For example, a change in overall traffic to top-of-funnel pages on your site may have little to no impact on actual sales. But if traffic has dropped way below historical averages for a key conversion page on your site (e.g. product detail page), it can absolutely impact your bottom line.
Looking for content decay periodically is a way to spot when this is happening and make updates to potentially save your company from months of decreased profits.
Some companies are using free tools such as Revive or ClickFlow to monitor content decay, but in our recent testing, we found that these tools can lead you to miss when and where decay is actually happening. In addition, the tools ask for access directly into your Google Analytics account without much concern for security, NDAs, etc. (which may violate your internal IT policies).
In this article, we’ll discuss the inaccuracies we discovered while testing ClickFlow and describe a relatively easy and more accurate process of using Google Analytics and Google Search Console to track and prevent content decay more effectively.
Feel free to use these links to jump ahead to any section and dive in:
- What Is Content Decay?
- Why Content Decay Isn’t Always Obvious When It’s Happening (and How to Accurately Track It)
- Our Recent Testing Using ClickFlow’s Content Decay Tool
- How We Used Google Analytics and Google Search Console to Spot Content Decay More Accurately
Note: We’ve been helping eCommerce companies with their SEO for over a decade. If you’d like us to improve your search traffic, detect and fix content decay, or improve your SEO in any other way, you can start a conversation with us here.
What Is Content Decay?
In general, content decay is when a website or web page has reached a peak in its ability to drive traffic and then begins to drop without recovery. You can look at content decay from an omnichannel perspective (PPC, social media, organic search, backlinks, email list, etc.), but most often, content decay is looked at in search engine optimization (SEO) and content marketing. Commonly, content marketers will monitor for content decay as a way to spot opportunities for refreshing old content.
What one is looking for is a negative discrepancy between expected and observed traffic. This means taking into account seasonality and other factors. For example, some of our clients have products that are only popular during Christmas. And others (such as the client case study described below) are more popular in the summer and less so around the holidays. Forgetting to account for seasonal trends is one of the common scenarios where companies think they’re experiencing content decay, when in reality, they aren’t. This can lead to making unnecessary page updates (which in some cases can harm rather than help traffic).
In the Google Analytics report below, we only take seasonality into account. Other factors like high impact Google algorithm updates or pandemics need to be accounted for by other means.
When looking at content decay, we aren’t concerned by the impact of the random daily or weekly short-term fluctuations in traffic. We select a longer time period — such as three months — because it helps us to see when there are clearly underlying (usually unknown) causes of decay.
Why Content Decay Isn’t Always Obvious When It’s Happening (and How to Accurately Track It)
There is a tendency for eCommerce management teams to pay more attention to overall website or blog traffic and less attention to the traffic of individual pages. This presents a problem when you want to spot content decay because while overall site traffic may not be decaying (and might even be increasing), it’s still possible for specific pages that are very important from a conversion or brand-awareness standpoint to be losing ground.
In order to clearly see when content decay is happening, you need to look at things on a page-by-page basis.
Beyond traffic, the other metric to look at when you track content decay is keyword rankings — which can also be an important indicator of decay. For example, even if you’re monitoring for traffic decay on a page by page basis, you might have a page that is showing steady traffic, but if it’s dropping in search rankings for the historically highest converting keyword, there still might be decay worth addressing.
If you were looking at traffic alone, you’d completely miss that.
Our Recent Testing Using ClickFlow’s Content Decay Tool
Recently we did some content decay research for one of our clients, and we tested out one of the popular content decay tools called ClickFlow.
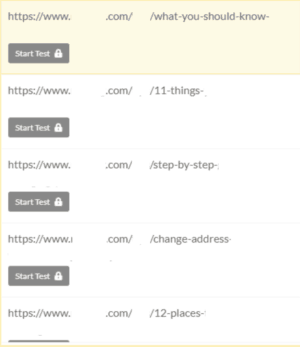
We tried out the tool, and it yielded the following top 5 results (which all turned out to be old blog posts):
To check the accuracy of these results, we used Google Analytics (which is ultimately the process we advocate using — described in detail below) to cross reference them. What we found was that only two out of the five results might actually be examples of content decay, whereas the other three were mostly seeing lower traffic due to seasonality. This means the false positive rate for the top five results was 60% at best.
We accounted for seasonality by viewing the data for each result in year-over-year format. In other words, we compared the data from 2018-2019 to the same time period in 2019-2020. Taking this longer view helped us to see the seasonal trends that were taking place and how they matched up recently compared to the year before.
Note: You’ll notice a fairly significant difference between the number of sessions the first year compared to the second (more recent) year. This is simply due to the data from the first year being close to the date of publication. Because the content is still fairly new, it takes Google time to crawl and position the articles in the SERPs.
Here are the two cases showing potential decay:
2 Cases Where Potential Content Decay Was Validated
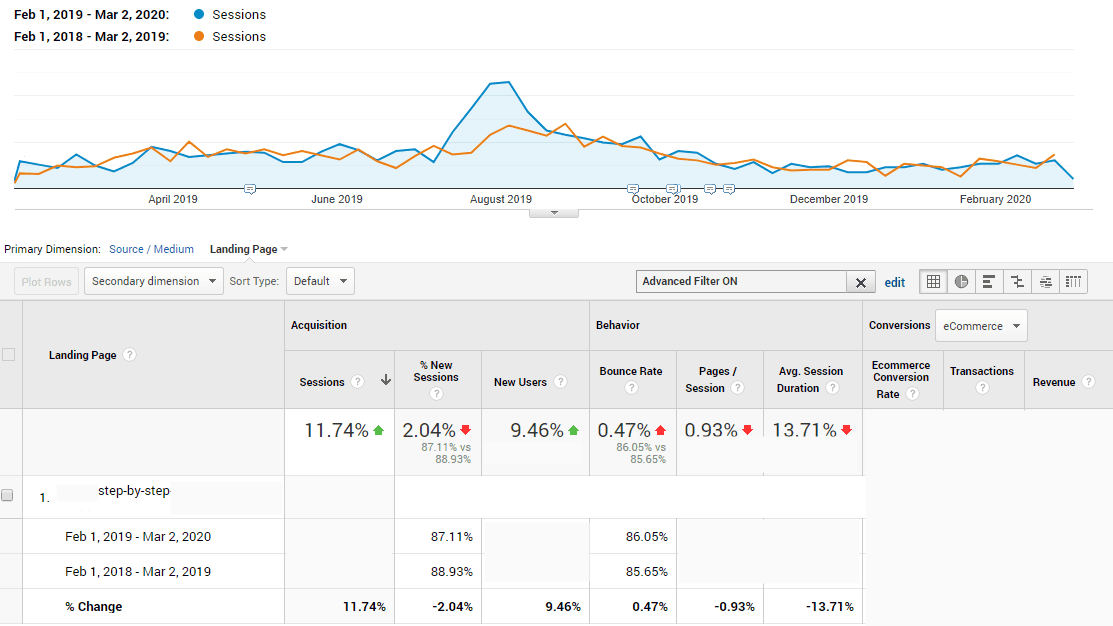
Result #2
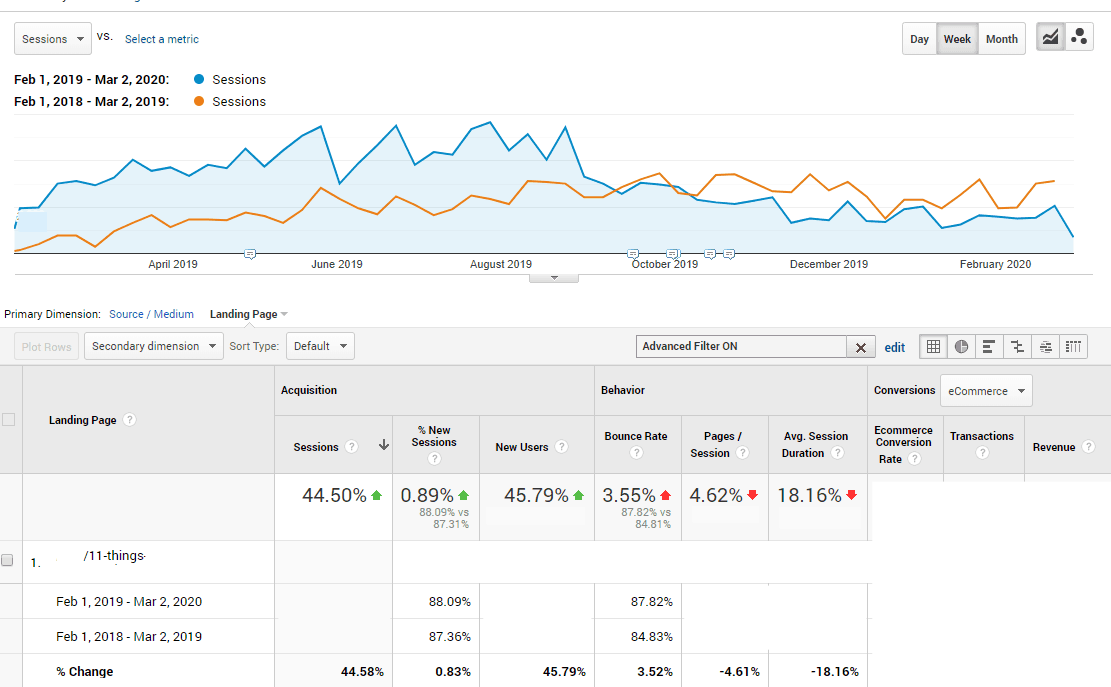
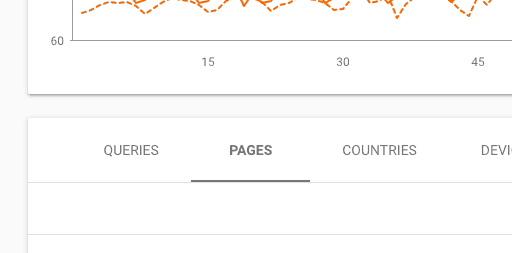
In this first example, seasonality is a factor, but when looking at the same year-long time frame matched up with the previous year, the blue line (the more recent year) dips below the orange line (the previous year) to an extent that indicates some content decay. And because it remains consistent over a period of several months, this is a situation we’d want to look at more closely to find the source of the problem.
Result #4
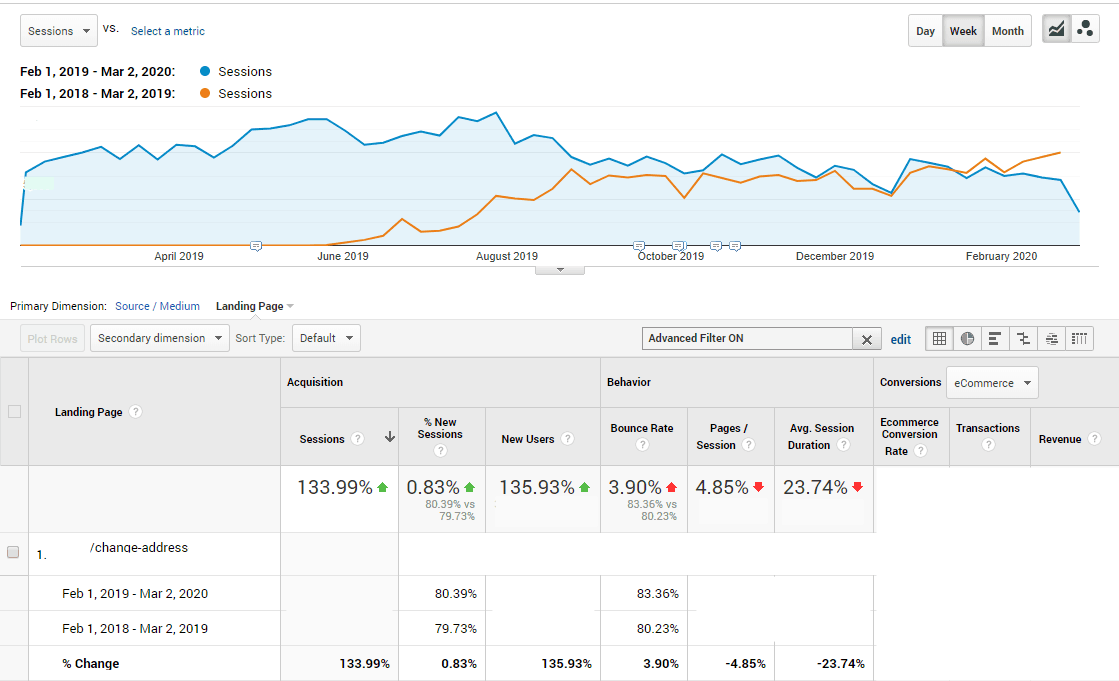
With this result, it’s possible that this post’s traffic began decaying in the month of February (on the right where the blue line dips below the orange line), but because three weeks of data isn’t enough time to know for sure that it’s decay, we’d be careful about jumping to conclusions. The difference is not small, but it’s not too large either, so we’d want to monitor this more and see.
3 Cases Where Seasonality Was Mistaken for Content Decay
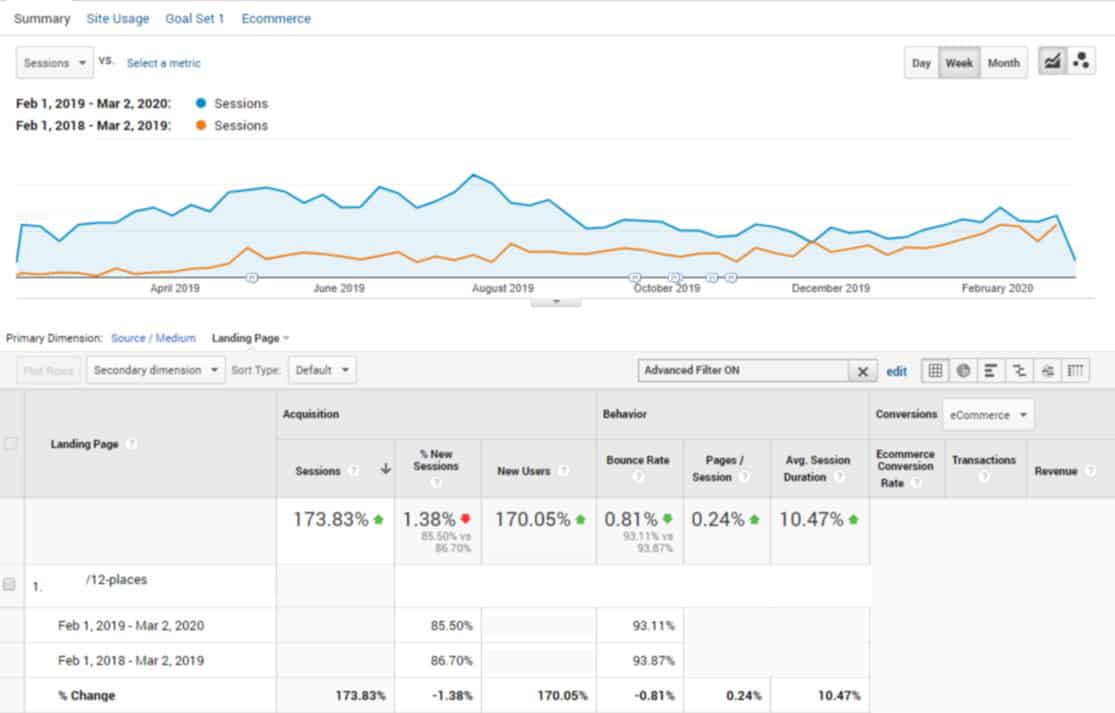
Result #1
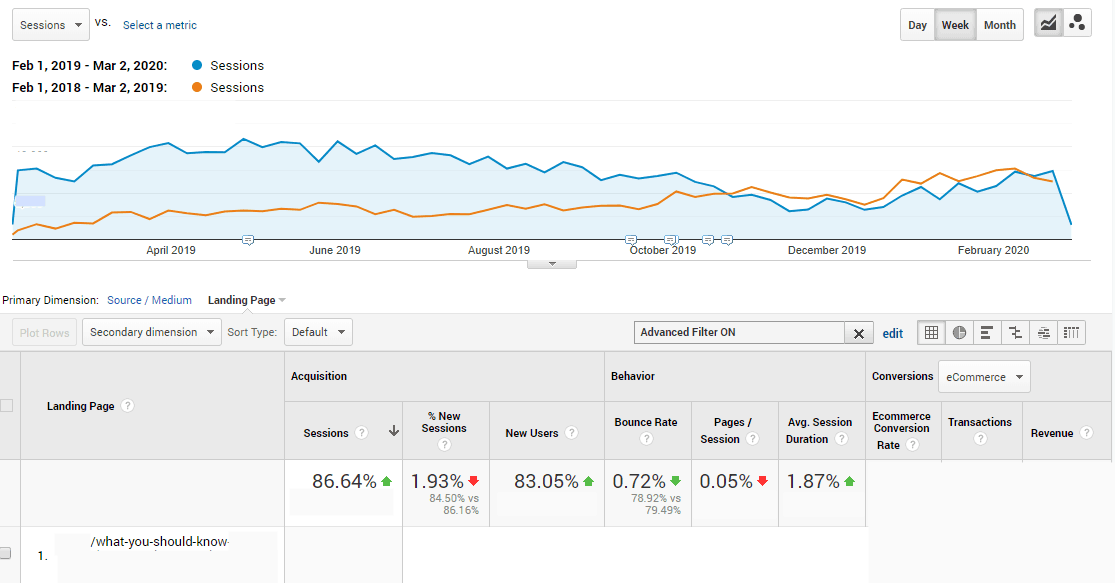
Here you can see a dip in traffic toward the holidays and then a rise after the first of the year, indicating this will likely continue to rise through spring and into the summer. Notice how the subtle decrease in traffic seen on the left side of the graph also indicates a similar trend in the year prior.
It seems the ClickFlow tool mistook the dip in traffic during the holidays as “content decay”, which in fact, doesn’t seem to be the case. Making changes to this blog post to try to “correct” for this would likely be a waste of time or, worse, could potentially hurt rankings. Looking at the traffic year-over-year in GA gives us a much clearer picture of what’s going on.
Result #3
Here, February of 2018 looks fairly consistent with February of 2019, and overall the traffic follows a very similar trend for both years. Occasional spikes, such as the one in August, can happen for a variety of reasons (e.g., one post happened to do particularly well on Facebook). The ClickFlow tool is likely interpreting the decrease in traffic from that August peak as content decay but comparing with the previous year shows clearly that that’s not true.
Result #5
Similar to Result #1, there’s a dip in traffic toward the holidays and then a rise after the first of the year that corresponds with the previous year (the blue line rises, falls, then begins to rise again at roughly the same times).
A Summary of the ClickFlow Test
Following this initial analysis, we proceeded to analyze the next five results as well. In the end, ClickFlow yielded a false positive rate of 50% at best, and 80% at worst.
As we saw in the examples above, if you want more accurate information when it comes to content decay, Google Analytics and Search Console can give you a much clearer and more accurate picture. What follows is our explanation of how to do this.
How to Use Google Analytics and Google Search Console to Track Content Decay More Accurately
Looking for Traffic Decay in Google SERPs Using Google Analytics
To start the process in Google Analytics, in the left side bar:
- Go to Acquisition > All Traffic > Source/Medium > google/organic
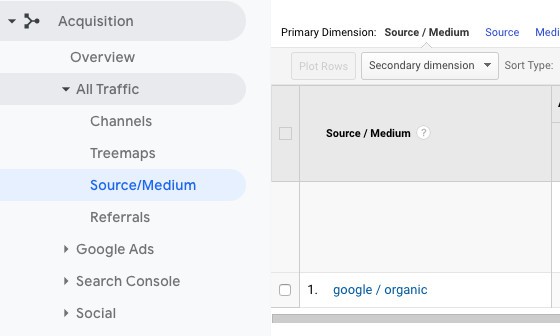
Now you’re filtered down to looking specifically at organic traffic data via Google.
Next step:
- Go to Secondary Dimension > Landing Page
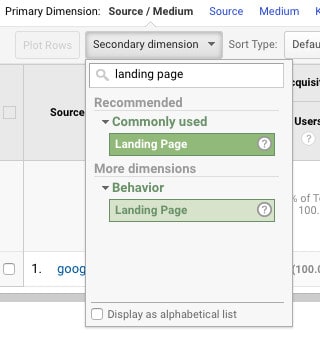
This will allow you to look for content decay at the page level. From here, select the time period.
Next step:
- Go to Date Range > Select Time Period
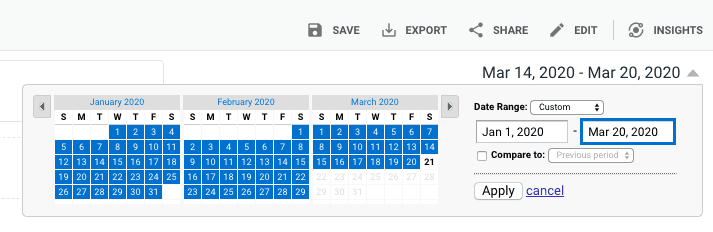
In the ClickFlow testing above, we used a long time period because we wanted to include the peaks ClickFlow was detecting in order to fairly assess what the tool was doing. But in general, the best way to do this is to view things on a three month time period year-over-year.
Next steps:
- Go to Compare to > Previous Year > Apply
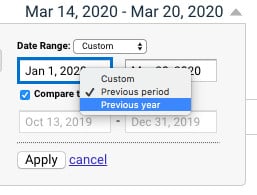
By selecting “Compare to Previous Year,” you can account for the factor of seasonality. Now you’re set to begin sorting the data and viewing the comparisons to see if there is content decay.
- Go to Sort Type > Absolute Change
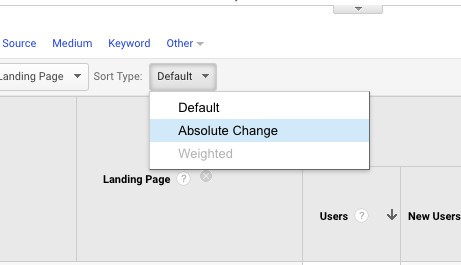
We sort by “absolute change” because it allows you to see the pages with the greatest gains or losses in traffic between the two time periods. It’s the change between the two time periods that helps us understand when decay is happening.
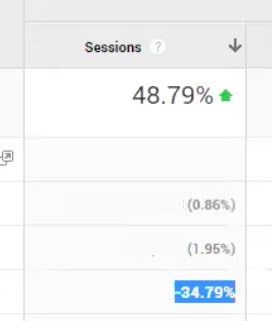
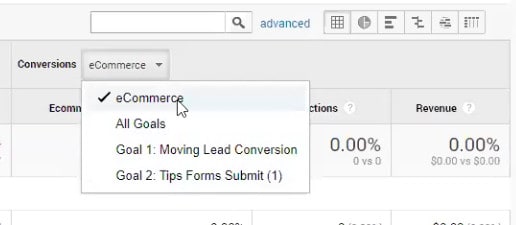
As another option, you can also sort by transactions (or a conversion goal, if you have one set) which can be particularly useful for an eCommerce business because it allows you to see the pages which have experienced the biggest change (drop) in actual sales as opposed to just traffic.
By using this process, you can take a closer look at the top five or 10 landing pages with the greatest decrease in traffic for the two time periods you’re comparing (in a way that accounts for seasonality). And the sorting function makes it easy to find them.
You can begin to make more educated decisions about what updates need to be made. To do this for keyword rankings, you can follow a similar process in Google Search Console.
Looking for Decay in Keyword Rankings with Google Search Console
Note: Unlike the examples above, the following explanation uses screenshots from our own website domain. Because ClickFlow and Revive only analyze traffic data (not page positions and keyword rankings), we didn’t do this part in our initial analysis for the client profiled above.
Start the process in the left sidebar of Google Search Console:
- Go to Performance
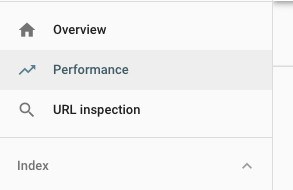
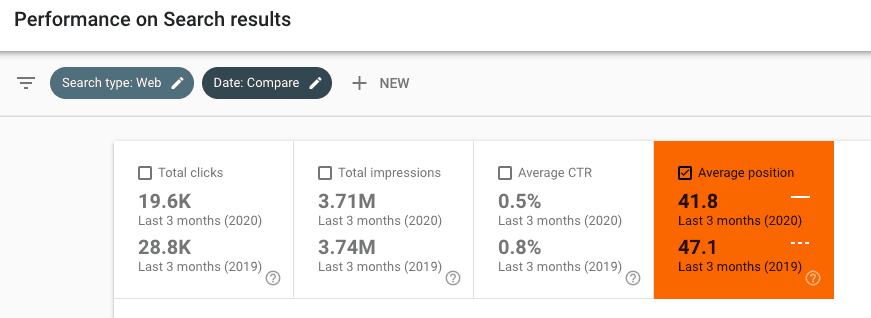
This will automatically show you search performance results for the last three months.
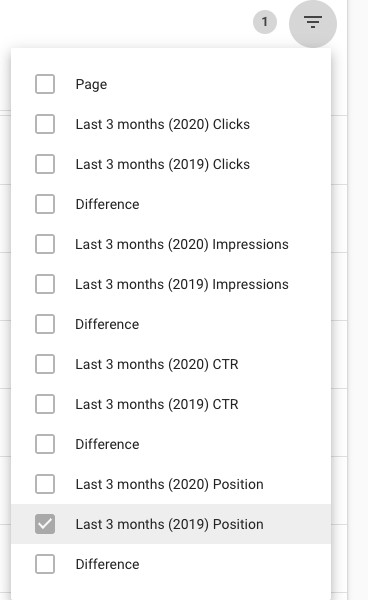
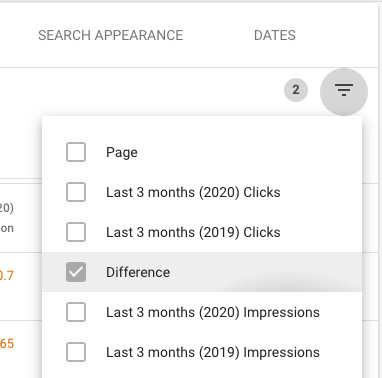
“Total clicks” and “Total impressions” will be selected automatically, but you’ll want to deselect them and instead click the check box for “Average position”.
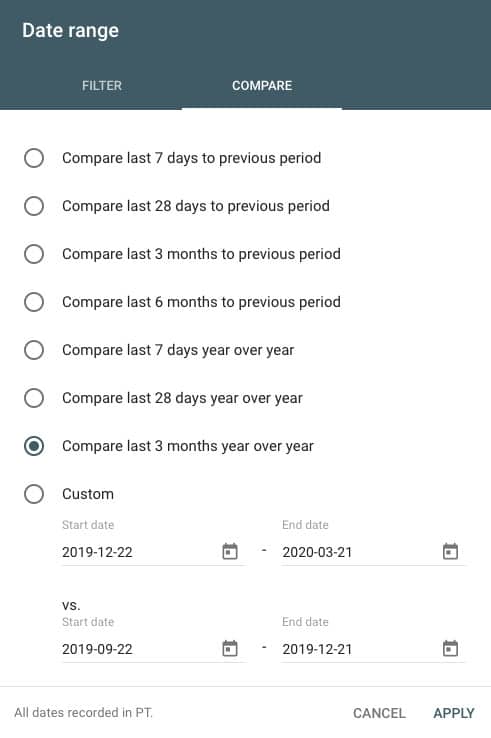
Next step:
- Go to Date range > Compare > Compare last 3 months year over year > Apply
Next step:
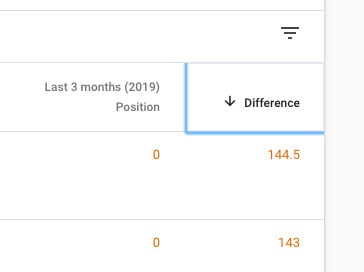
- Go to the table below and select the Pages tab
From here, you’ll be able to begin looking at the way that average position rankings for specific pages have changed. And just like in Google Analytics, you can begin using the filtering options in the table to sort the data.
Instead of “Absolute Change”, Search Console allows you to use the “Difference” filter for each of the metrics you’re viewing to see how clicks, impressions, and keyword positions for the comparison time frames differ. This is what allows you to spot areas where content decay might be happening from a SERP perspective.
Next Step:
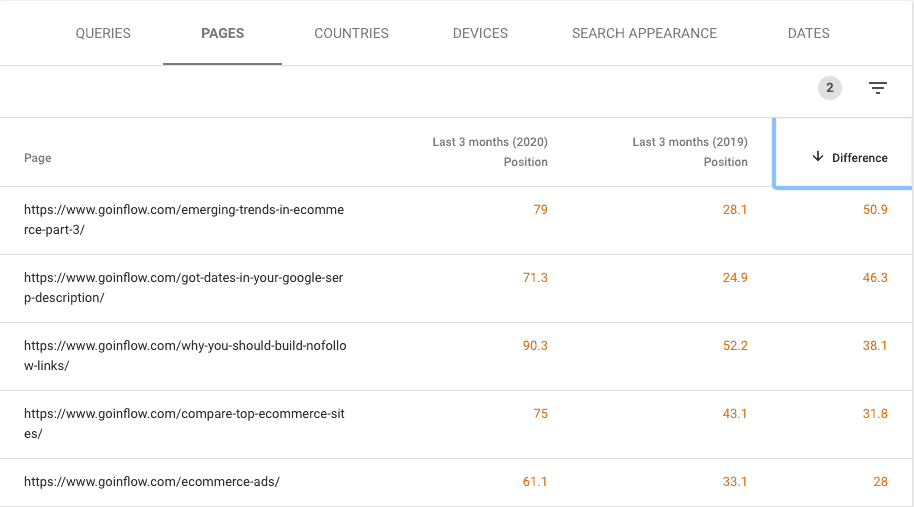
- Go to Difference > Sort by descending (arrow pointing down)
Descending order allows you to immediately see the pages where the biggest difference in average position has occurred between the two time periods. From here, you want to apply a few filters for further examination.
Next step:
- Go to Filters > Select Last 3 Months (Previous Year) Position > Select “Greater Than” > Enter “0”
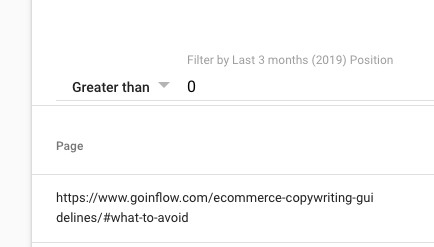
Filtering to show results that are “Greater than 0” allows you to exclude pages that weren’t previously ranking and therefore would not qualify as content decay. From here, you add one additional filter before you begin analyzing the results.
Next step:
- Go to Filters > Select Difference (under Last 3 months (Previous Year) Clicks) > Select “Smaller Than” > Enter “N”
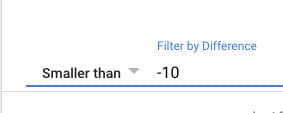
By filtering to a difference in clicks that is smaller than “-N”, where “N” is a meaningful number of lost clicks between the two time periods, you’re able to narrow down the number of results to a manageable number for manual analysis. “N” should be kept fairly low (5-10) to get an adequate range of results.
Once you reach this point, you can begin inspecting the individual pages to determine whether you need to take action or not.
For example, if we look at our first result (emerging-trends-in-ecommerce-part-3), in 2019 it was ranking around position 28, and in the same three months in 2020 it’s been ranking around position 78.
To surface the most impactful decays, you’d want to switch the metric to “Clicks” only, then sort by “Difference” in ascending order. This will put pages which lost 1000 clicks year-over-year above those which lost only 100, regardless of how bad the average position difference is for the same time comparison.
These would be your top prospects for investigating further for content decay. To do so, you can click on each of the URL’s individually for a closer look.
Putting This into Practice
The beauty of the sorting functionality in both Google Analytics and Google Search Console is that this process doesn’t need to take a lot of time. You can simply do a reverse sort to view the 20-30 pages or keywords that are losing the most traffic, conversions, clicks, or rankings. This is an easy way to see where the most significant decay might be happening.
We recommend going through this process every few months (in some cases, quarterly might be fine as well). In fact, doing so more often than that (e.g. weekly) can be overkill and potentially even harmful, leading you to waste resources making unnecessary changes to otherwise great content.
Tracking content decay is part of what we do in our SEO services. If you’d like to talk with someone on our team to see what actions could be taken to improve SEO for your eCommerce business, you can start a conversation with us here.
The research and insights presented in this article were provided by a long-time friend and consultant at Inflow, Georgi Georgiev. Georgi is an expert in web analytics and runs Web Focus LLC, a boutique online marketing company behind products like Analytics Toolkit.
 from Inflow https://ift.tt/2XVU54x via IFTTT


No comments:
Post a Comment