Showing posts with label Blog – BlueStout. Show all posts

Is 30% of Your Revenue Coming From Email? If Not, Then It’s Time to Ask These Questions

When clients come to me searching for ways to scale up online revenue, the first thing I always ask is this:

“Are you driving at least 30% of your online revenue from email?”

If not, there is your low-hanging fruit opportunity.

Too often, I see e-commerce entrepreneurs fail to fully utilize email marketing.

And it’s costing them LOST revenue. And a lot of it.


If you’re not at 30% yet, it’s time to start figuring out why by asking these questions:


      1. Have I set up at least 6 to 10 automated flows (each comprising of 3 to 6 emails)?
      2. Is my email list segmented based on customer engagement (10 to 20 segments)?
      3. Am I sending at least 8 manual campaigns per month?
      4. Are my email open rates consistently between 20 and 40%?
      5. Are my automated email flows bringing in 50% of the revenue from my email marketing?

Let’s look at each of these specifically:

1. Have I set up at least 6 to 10 automated flows (each comprising of 3 to 6 emails)?

So you’ve asked for email addresses from your site’s visitors and many have shared this valuable information. So what are you doing with it?

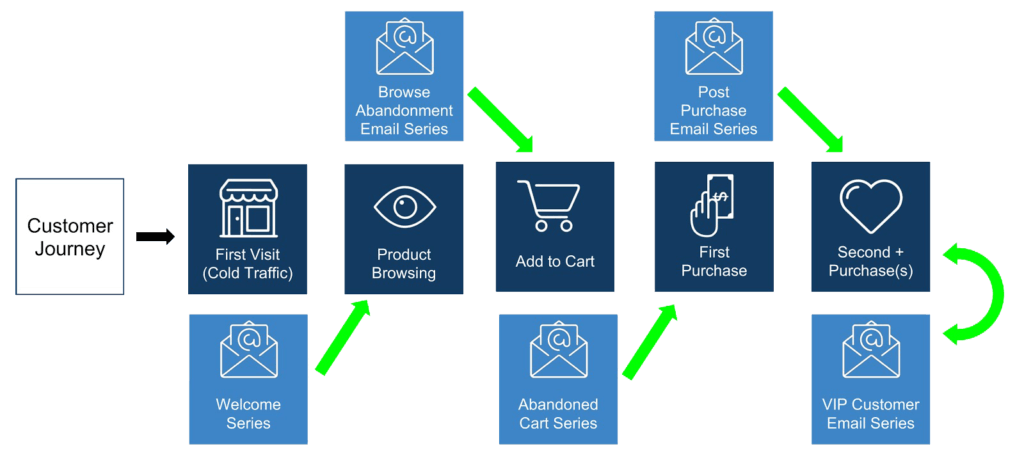
You should be creating automated email flows to set up a line of communication with your customer at each stage of their journey with you. The goal of each email is to gently push the customer one step closer to buying their first product, and then continue buying in the future.

customer-journey

Let’s look at six critical points in your customer’s journey and what your email automations should look like:

A. When a customer visits your store for the first time

Too many store owners get this very first touch point wrong.

How?

They propose marriage on the first date.

advanced-ecommerce-email-marketing-marriage-on-first-date

You need to understand that it’s perfectly normal for your first-time visitor to not buy – so don’t get upset if your conversion rate for new visitors is low.

I’ve found that a potential buyer is typically going to need anywhere from 5 to 15 experiences or touch points with your brand before they are ready to open their wallet.

So your goal with new visitors isn’t to force an instant sale.

It’s building a relationship with them.

For example, you can send a series of welcoming emails that tell your story, point out how you are unique, and explain why they should trust you.

gathre-welcome-email


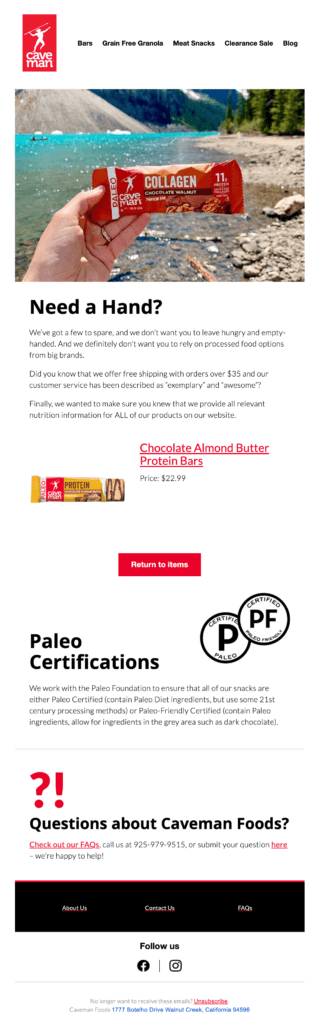
B. When the customer browses but leaves without spending (browse abandonment)

What’s holding your customer back?

That’s what you need to address in an email.

Maybe they need to see what other customers think about your brand, so spotlight some positive reviews. Maybe they need a nudge in the form of a discount or free shipping offer.

Try testing out different options to see which increases your click-through rate or conversion.

The numbers will tell you when you’ve found the right technique.

effective-email-marketing-browse-abondonment-email

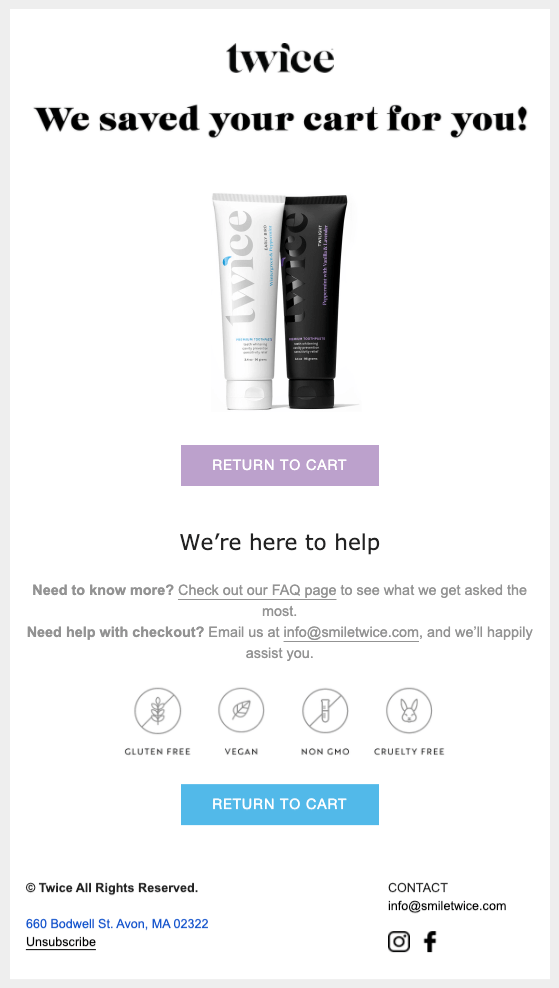
C. When the customer adds item(s) to their cart but abandons it

Abandoned carts are your enemy.

Think about it, you’ve got the customer just to the point where they are going to buy and then…..they bounce.

Fortunately, you can still reach out to them because you’ve got their email address.

Something as simple as a reminder about the item they left behind or an incentive (free gift, free shipping, discount, etc.) can bring them back to buy.

The bottom line is you don’t want to lose customers who have come this far in your sales funnel.

Be smart but aggressive here and don’t hesitate to send multiple emails or use bigger incentives (based on cart value) to reel them back in.

effective-email-marketing-cart-abondonment-email

D. When the customer completes their first purchase

At Blue Stout, we always tell our clients this:

You’re not in the “making sales” business. You are in the reorder business.

And do you know when customers are most open to buying again?

Pretty much right after they just bought from you.

Yep, that’s right.

Face it, shopping gives a lot of us a good buzz. And that happy feeling will instantly make your customer feel loyal to your brand.

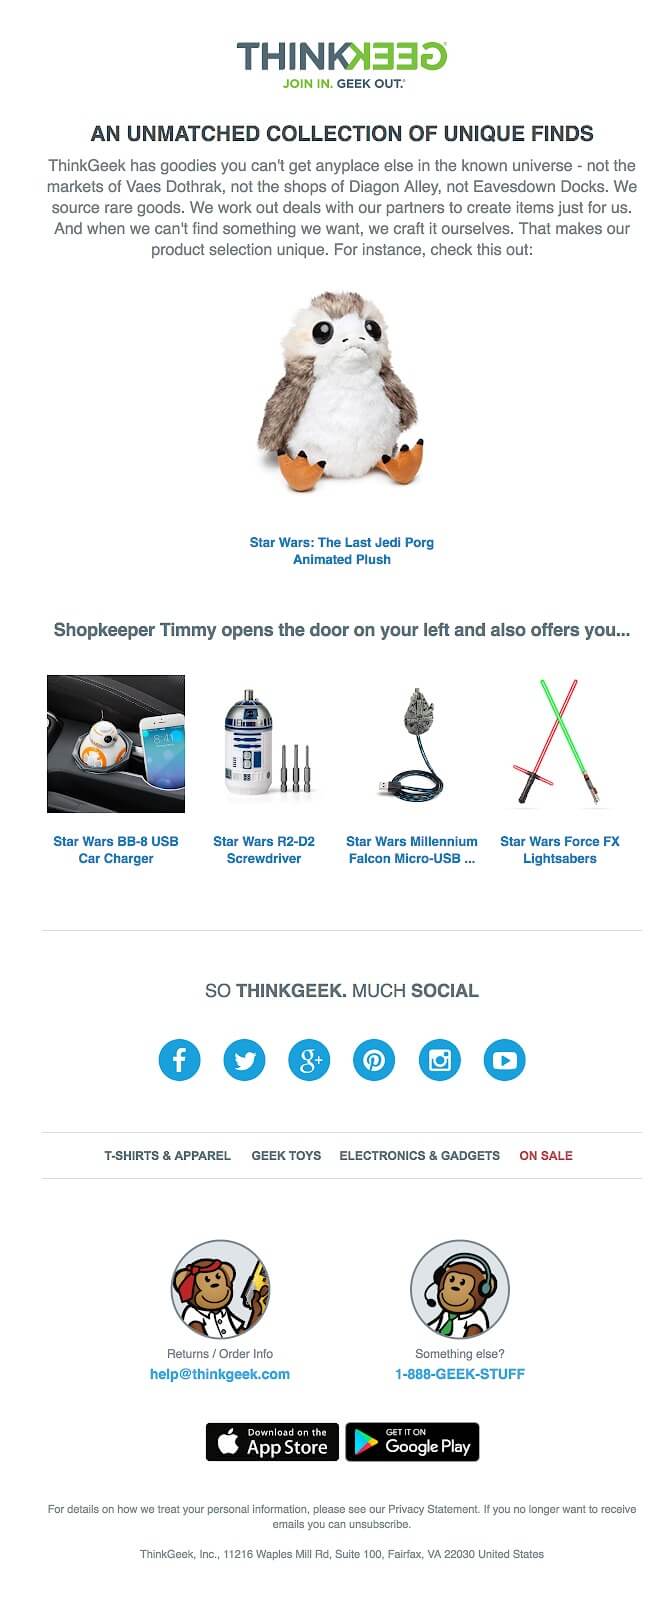
Your goal with email marketing is not to let that feeling pass without some speedy post-purchase emails to thank the customer and make them feel part of your brand’s community.

You can kick this messaging off right away after a purchase with the sales receipt you email.Too many businesses miss this marketing opportunity and it’s a simple way to make your customer feel valued, tell them more about your company, and cross-sell.

After that instant email receipt, make sure to send an automated flow of emails for at least two weeks after that first purchase is made so you can foster a relationship with your new customer.

effective-email-marketing-think-geek


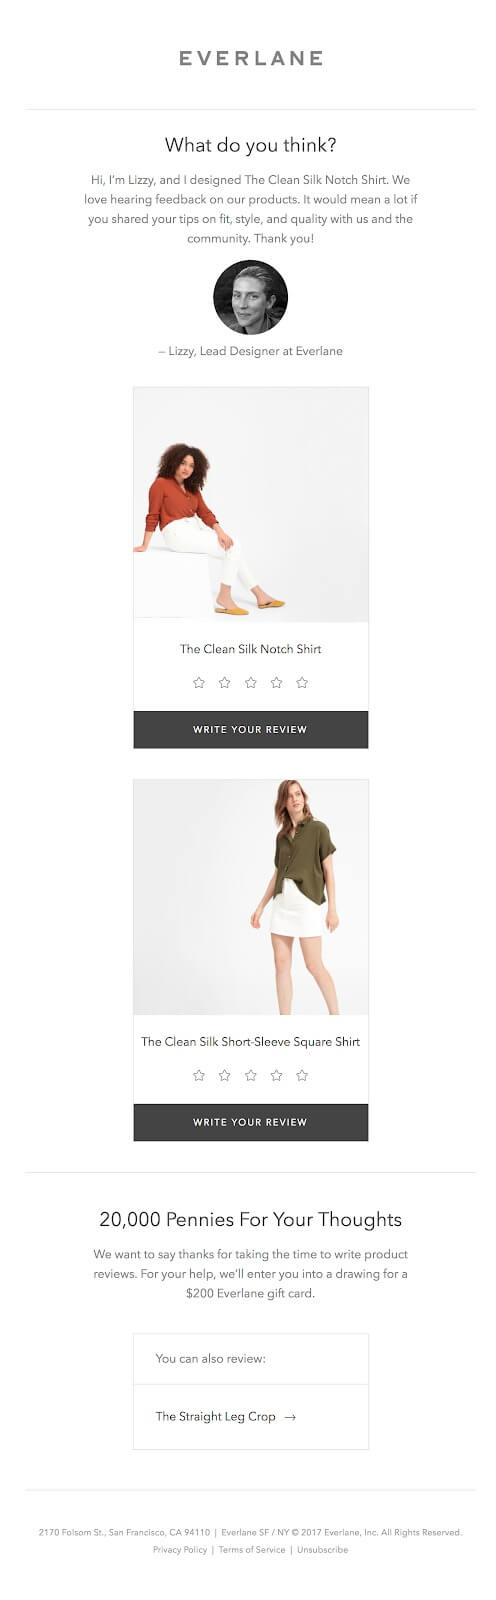
effective-email-marketing-everlane

E. When the customer returns to your site again

So you’ve succeeded in convincing your customer to buy once.

How do you do it again?

It’s pretty simple.

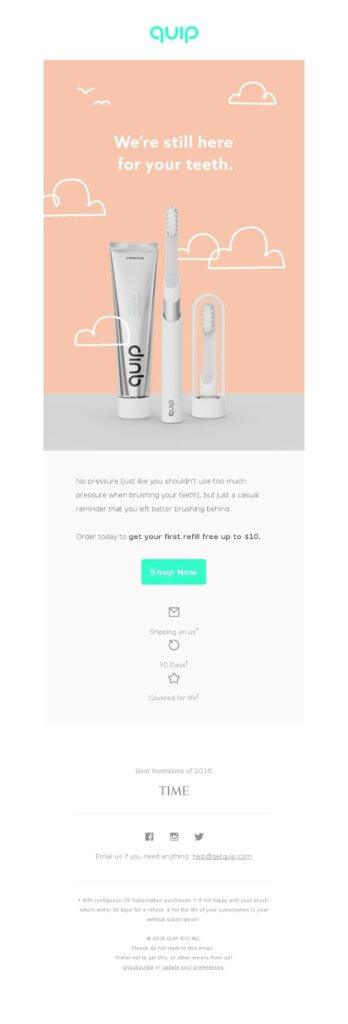
Roll out your best offers here – think cross-selling, subscription offers for consumables, tiered discounts, or a special offer just for customers at this point in their journey with your brand.

You can do this best by sending automated email flows to customers every time they buy.

You can also segment customers further (by the type of products they buy, how much they spend, how often they shop, etc.) and send emails that are even more personalized.

Remember, targeted emails are key – you need to get the right messages to the right customers.

quip

F. When customers hit “power buyer” or “mega fan” status

You love this customer — be sure to let them know.

Send emails to note milestones in their relationship with your brand, such as the first time they made a purchase.

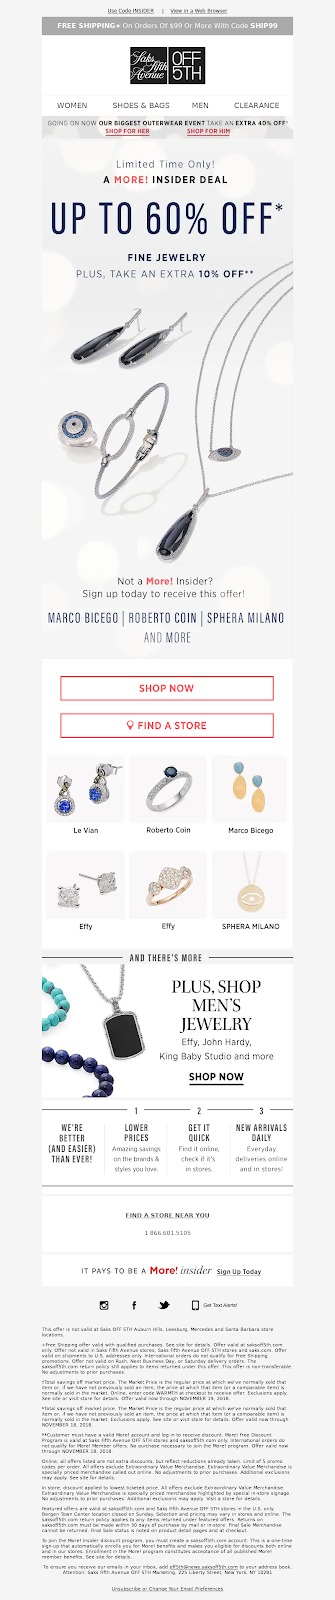
Offer them special pricing, limited-edition merch, or first dibs on new products.

You want them to know you recognize and appreciate their loyalty.

Once you’ve created a mega fan, don’t miss the chance to let them promote you. For example:

        • Ask them to review your product(s) online

      • Start a loyalty/referral program to reward them for sending customers your way

saks-off-5th

2. Is my email list segmented based on customer engagement (10 to 20 segments)?

To be successful, your email strategy has to be dynamic and meet your customers where they are in their journey with your brand.

For example, you might see your customer take this journey:

      1. Visits your store for first time
      2. Browses products and leaves
      3. Visits again
      4. Adds items to cart but leaves again
      5. Returns a third time
      6. Buys!
      7. Returns four months later to place a second order
      8. Over the next 12 months, becomes a loyal power buyer

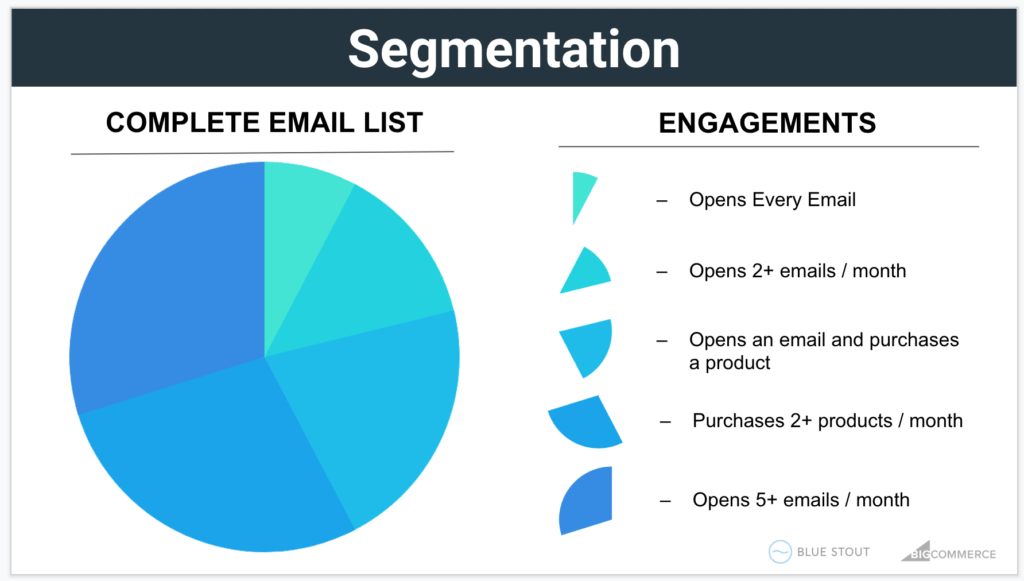
To get the most out of the emails you send, you need to break your customers into segments based on their engagement with your brand. Consider their recent visits to your site, clicks on emails, their interests, spending, etc.

Segmentation

In short, creating segments ensures you get the most out of your email list. You need to understand who your audience is, how often they want to hear from you, and what content they are interested in.

For example, some customers want to receive every email you send. Others only want to hear from you once a month or less.

By sending content at the cadence a customer wants, they will be more likely to open it, engage and buy.

At the bare minimum, you should be segmenting your email list based upon engagement. For example, which people on the list have visited your site or opened an email in the past 30 days? Or who on the list has purchased once, twice, or more in the past 90 days?


3. Am I sending at least 8 manual campaigns per month?

Manual email campaigns are best for monthly newsletters and letting customers know about special events, flash sales, and new quality content.

Pretty simple, huh?

Well there’s still a lot of ways companies get it wrong.

For example, they shoot these emails out to every single person who has ever given them their email address.

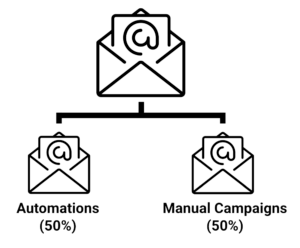
For manual campaigns, you want to send a mix of sales, promotions, product launches and high-value content (recipes, etc.). At Blue Stout, we see a 50/50 mix of sales content and other high-value content as the best strategy.

advanced-ecommerce-email-marketing-automations-vs-manual

In general, eight campaigns tends to be the happy medium between sending enough email and not sending too many. But remember, this is only if you are aggressively segmenting your customer list.


4. Are your email open rates consistently between 20 and 40%?


advanced-ecommerce-email-marketing-open-rates


We can’t talk about this without first talking about the health of your email address list.

Email list health is the most overlooked part of most people’s marketing plan and an unhealthy list will kill even the best email marketing plan in a flash.

In fact, I’ve seen too many brands that have had their email revenue slashed in half due to poor email list management.

What goes wrong?

They send too many emails to too many customers who don’t engage, causing email open rates to drop and opening the door to Google sending future emails straight to spam.

Meaning no one sees that fabulous email offer or gets the invite to the special online event you’ve been planning for months.

Remember, as your email list grows it increase in value, but only if the emails you send end up in an inbox and get opened.

OK, now let’s talk open rates.

How many of those emails that you send get opened?

While email marketing does better in some industries than others, the average open rate overall is 20.81%. For ecommerce businesses, it’s just under 16%.

Once you factor in click rates — the average click rate is only 2.4 percent — then you have a very small window of opportunity to connect with a customer.

That’s the bad news.

The good news is even if your open rates are lagging around 10 percent right now, you might not need to overhaul your entire email strategy.

At Blue Stout, our clients see open rates ranging from 20 to 35% for manual campaigns and 30 to 40% for automated flows. Why?

Here are just a few reasons:

        • Segmentation – Sending the right message to the right people increases open and click rates
        • Solid email marketing design and technical build – Email is finicky and to get emails delivered you need to design and code them correctly
        • Clear email subject lines – Clear versus clever works every time

Given the revenue it can create, your email marketing strategy should always be a priority, not an afterthought.


5. Are automated email flows bringing in 50% of the revenue from my email marketing?

Most brands should be generating at least 25 to 35% of their total revenue from email.

In general, there should be a 50/50 split between revenue from your automated email flows and revenue from your manual campaigns.

If you’re not there, it’s a sign that you are either not running enough automated flows, not segmenting your list properly, or the content of your flows is not optimized for sales.


FINAL THOUGHTS

When done effectively, email marketing can help you get the right message at the right time to the right customer — building loyalty, boosting sales and creating a promoter.

Great ecommerce stores – ones who have a robust email marketing plan – can pull in more than 30% of their revenue from their email efforts.

If fact, email marketing is one of the easiest and fastest ways to grow your revenue and boost profits from the customers who are already visiting your site.

That’s why email should be your highest ROI sales channel.

nurture-to-first-purchase

The post Is 30% of Your Revenue Coming From Email? If Not, Then It’s Time to Ask These Questions appeared first on BlueStout.


from Blog – BlueStout https://ift.tt/3iAQWOh
via IFTTT

SHOPIFY FLOW – How to use Shopify automation with real-world case studies.

What happens when your product inventory is low?

Or when a customer becomes a VIP by repeatedly buying?

How about when a customer leaves a negative review because they are unhappy?

These are all incredibly important things for you to know about.

Yet too many brands let details like this slip through the cracks and miss an opportunity to make sure customers are heard and appreciated, and problems are solved.

So how do you do it right?

Setting up automatic, reactive “templates” using Shopify Flow is both simple and a great way to make sure your business thrives and your customers are promoters.

Shopify Flow is a platform that makes it easy to automate tasks both in your store and a number of apps you are probably using.

Here’s how it works:

  1. You choose from a library of templates or use Shopify Flow to customize a workflow for your business. For example, you can automate the buyer experience, manage your marketing and segmentation, easily track and reorder inventory, manage orders and reduce risk, reward loyalty and send out promotions.
  2. Sync your favorite apps (Shopify Flows works with dozens of apps, including Asana, Klaviyo, Trello, etc.) and integrate it with your Slack channel, email, and HTTP requests.
  3. Relax and let Shopify Flow do the work so you can get more done, faster.

It’s really that easy.

Shopify automation templates basically work like this: if “this” happens, then “that” will automatically happen as a result.

For example, say a customer makes a second purchase and you want to thank them with a reward. You can use Shopify automation to send an email to this customer with a discount code for future purchases.

So how should you be using Shopify automation? With Flow, there are countless automations that can be created.

At Blue Stout, we recommend these automations as MUSTS:

Get notified when product inventory is low


Running out of a product that’s in demand is just bad inventory management.

Shopify templates give you several ways to learn when stock is getting low. For example, one template will send you an email when inventory falls below a certain threshold, which you choose.

There are also other ways you can be notified of low inventory when you use Shopify automation:

  • 

Automatically add a card to a Trello board when inventory drops to a certain number
  • Initiate a reorder with when a product has low inventory by sending an email to your vendor

Customers don’t like to see “out-of-stock” notifications and in many cases will take their business elsewhere when they do. Don’t let inventory issue take away from your profits.


Remove out-of-stock items from your site


To my last point about how shoppers hate learning that products are out of stock, Shopify allows you to temporarily remove these items from your shopper’s view.

This means you can set up the automation to hide out-of-stock (or low stock) products from your online store and automatically republish when they’re back in stock.

This way your customer doesn’t have a sense of what they are missing, only what’s available, which is a much better experience for them.


Re-order products based on demand


Sometimes good inventory management includes NOT reordering a product.

Many products have a lifecycle and if sales are dropping (or were never great to begin with) you can set up automation to help you make sure you only re-order in certain scenarios.

For example, there’s a template that will notify you if a certain out-of-stock item has 10 customers waiting for it to be restocked.

By knowing the level of demand for a product, you can decide whether it’s worth restocking it.


Segment customers by purchase behavior


At Blue Stout, I talk a lot about how important breaking your customers into segments is. You need to know your customers so you can personalize their experience with your brand as much as possible.

By simply setting up this Shopify template you can tag customers by their buying preferences and then use that info to create personalized, targeted marketing emails.


Tag orders by the payment gateway


Not sure if you are offering the best payment options for your customers? Shopify Flow lets you tag new orders with the payment gateway that was used to capture the customer’s payment.

Seeing how customers are using your various payment options, and more importantly, how it affects sales and conversions is critical information to know if you want to offer the payment options that help customers buy faster and easier.


Tag orders by sales channel


Sales Channel is HUGE. You want to know what channels are driving the most sales and what channels drive sales of different products.

Why? You need this info to intelligently talk to your customers and market the right products to them at the right time.


Tag and track conversion of customers who order samples


If you’re spending the money to send out samples you need to know if the expense is worth it.

This template allows you to segment the customers who ordered a sample to see if they ended up buying at full-price later.


Get a daily email with top store searches


Do you know what your site’s visitors are searching for? I’ve met with many brand owners who don’t have a clue.

Sure, they might know their bestseller, or maybe even the top five items based on sales.

But what customers are buying can be different from what they are searching for.

What’s the value in knowing what shoppers are searching for on your site?

For one, you might learn shoppers expect you to sell a certain product that you aren’t, meaning if you add that product there’s money to be made.

It can also show you how customers refer to a product, allowing you to fine-tune the algorithm that powers the search results by adding additional keywords.


Get notified about negative reviews 


Unhappy customers will broadcast their dissatisfaction louder and farther than any happy customer will praise you.

So you need to take action when a bad review appears and work to resolve the matter asap. To this end, Shopify has several templates to help you.

For example:

  • Get notified when you receive negative reviews. Get an email when you receive a negative review in Stamped.io reviews.
  • Email customers who write negative reviews. This automation allows you to use Klaviyo to track when a customer submits a negative Yotpo review and reach out to them with an email offering support.
  • Create a support ticket when you receive a negative review. Want your customer service team to research the issue further and reach out to the customer? Use this template to automatically send a ticket in Gorgias when a negative Stamped.io review is spotted.


Email logistics team when orders need to be expedited


When a customer pays for speedy shipping you want to make sure you aren’t the cause of a delay.

It’s super easy to set up a template so that the order is tagged and an email is sent to your shipping team so they know that the customer has paid for expedited shipping.


Send browser push notification for specific product releases

This is a great one for marketing. This automation allows you to shoot a push notification to all of your PushOwl subscribers when you launch a new product, a limited edition, etc.

All you need to do is add a “Push notification” product tag to an item and set up this template, and your customer base will be notified.


Send browser push notification when order is shipped

Most customers will be impatiently waiting to receive their order and will want to know exactly where their shipment is.

Don’t make them reach out to your customer service or wonder — send a browser push notification to any PushOwl subscriber when their order has been fulfilled.


Text a discount code after 2nd order

Getting a repeat customer is a big win, so don’t celebrate alone.

Thank this customer with a discount code for their next purchase.

It’s as simple as setting up a template so that when your customer buys that second time, they receive a text message (using SMSBump) with the savings code.


Issue a gift card to a customer after 3rd order

So your customer has ordered for the third time?

This is big — you are building a megafan.

Don’t make the mistake of taking this customer for granted. Set up an automation to issue and email a gift card to the customer with GiftWizard.


Reward loyalty points 

Customers love rewards.

Build in a loyalty point system for your site and then let Shopify automation help you dole out the points. For example:

  • Add points in Swell Rewards when a customer completes a survey through Enquire Post-Purchase Surveys
  • Add points in Swell Rewards when a customer requests to be notified when an out-of-stock item is back in stock.


Personalize store experience for VIP customers

One of the things I love most about Shopify is that it really allows you to easily create a system of automatic rewards for your best and most active customers.
For example, you can give VIPs a personalized store view when they spend over a certain amount.

Why? It gives you a chance to market select items to this customer and share with them, based on previous purchases, products that they might like.


Final Thoughts

At Blue Stout, we are big believers in the power of Shopify Flow automation.

Honestly, too many entrepreneurs and their teams are spending way too much time dealing with issues that could be handled faster and better with automations.

Why spend effort you don’t need to?

Well-used automations can help you boost sales and grow customer loyalty. Plus, you will truly know your customer, which is going to make marketing to new customers so much easier.

The post SHOPIFY FLOW – How to use Shopify automation with real-world case studies. appeared first on BlueStout.


from Blog – BlueStout https://ift.tt/2RImHda
via IFTTT

How to track the KPIs that matter in Google Analytics

Successful ecommerce managers make decisions not on hunches, personal leanings or even one-off patterns; they make decisions based on metrics.

These managers know the state of their store’s performance, buyer behaviour, product trends, and the parts of your store that deserve the most promotion.

While there are thousands of metrics for stores to track, only a few KPIs are relevant to the state of your store. These are the metrics that can be turned into actionable insights for your store to accelerate your path to scale.


Which metrics should you care about?

While there are hundreds of metrics worth reviewing over time, only a few KPIs offer a true measurement of your ecommerce performance:

  1. Customer Acquisition Cost (CAC)
  2. Shopping cart abandonment rate
  3. Product page load speed
  4. Average Order Value (AOV)
  5. Customer Lifetime Value (CLV)

We’ll dive into each KPI, including how to 1) calculate them and 2) measure them in Google Analytics. Each of these KPIs are great indicators of progress or areas for improvement for your online store.


Knowing the GA basics

There’s one GA metric that sometimes goes overlooked among the sea of metrics — your audience. GA can provide diverse and segmented info about your store visitors, including:

  • Where they live
  • What language they primarily speak
  • Their on-page behavior
  • Their browser and device info
  • Their age, gender and income
  • The type of customer (first time or returning)

This data is valuable because it offers insight as to how visitors interact with your store, while empowering you to test landing pages and product pages in a way that caters to visitors’ behaviors.

GA also provides a flowchart that shows which landing page brought visitors to your site in the first place, the pages they scrolled on your store, the products they bought, and how long they were exploring your site.

And let’s not forget traffic sources. GA provides rich data on where your visitors come from online — if they’re coming to your store directly (by typing in your URL) or through a browser search (Google, Facebook, or another place where ads may be shown).

Now let’s get into the good stuff — tracking the KPIs that matter.


How to track Customer Acquisition Cost (CAC)

Why does it matter?

It’s a no-brainer that every business wants as many customers as possible — but not if it means going bankrupt. Online stores need to track customer acquisition cost (CAC) to know exactly the “debt” they incur to bring a single customer on board. CAC is literally a calculation of what it costs to acquire an average customer.

For the most part, if your store is losing money every time a customer makes a purchase, you won’t be in business very long.

CAC and cost per acquisition often get mixed up, but they’re two distinct metrics that measure different things.

CPA is an “umbrella” term that covers a number of acquisition events, like a user opt-in or a click. On the other hand CAC is the actual cost to acquire a paying customer (or subscriber).

When it comes to CAC, it doesn’t matter how your lead arrived — whether through a landing page, paid search, a blog post or a free trial offer. This metric is an “overall” metric that accounts for every customer purchase within any given period.


How do you track CAC in Google Analytics?

The simple formula for calculating CAC:

CAC = Sales & marketing costs / # of customers brought on board (within given time period)

Here’s where you can find CAC in Google Analytics:
how-to-track-the-kpis that-matter_01

Example:

Alice runs a Shopify store that sells online accessories for women in their 20s. From January 2019 to July 2019, Alice spent $800,000 in sales and marketing (paid search, content marketing, team salaries, etc.).

During the same time frame, Alice sold 80,000 accessories on her store. Alice’s customer acquisition cost for that 6-month period is $10.


Related metrics that matter

Sales conversion rate on mobile/desktop

This is a vital comparison between desktop and mobile and which pages and products convert better on which devices. Typically, desktop conversion rates are more than double that of mobile.
However, average add to cart rates aren’t trailing by much. In fact, SaleCycle says the average mobile add to cart rate is 10.4%, just a few percentage points behind desktop’s 12.9%. What does this mean? In short, more shoppers are bailing during or around the checkout process. More on that later.

Average email signup rate

According to Sumo, the average email signup rate is 1.95%, with the top 10% of email marketers above a 4.7% success rate.

Average referrals from Facebook/Twitter

Referral traffic is how Google reports visits to your online store outside of “normal” Google searches. This includes “outside sources” like Facebook and Twitter, both popular sources of referral traffic.

When someone clicks on a hyperlink to visit a page on your store, GA tracks that click as a referral visit from the social media platform being used.


Tracking shopping cart abandonment rate

Why does it matter?

It’s a no-brainer that every business wants as many customers as possible — but not if it means going bankrupt. Online stores need to track customer acquisition cost (CAC) to know exactly the “debt” they incur to bring a single customer on board. CAC is literally a calculation of what it costs to acquire an average customer.

For the most part, if your store is losing money every time a customer makes a purchase, you won’t be in business very long.

CAC and cost per acquisition often get mixed up, but they’re two distinct metrics that measure different things.

CPA is an “umbrella” term that covers a number of acquisition events, like a user opt-in or a click. On the other hand CAC is the actual cost to acquire a paying customer (or subscriber).

When it comes to CAC, it doesn’t matter how your lead arrived — whether through a landing page, paid search, a blog post or a free trial offer. This metric is an “overall” metric that accounts for every customer purchase within any given period.


How do you track CAC in Google Analytics?

The simple formula for calculating CAC:

CAC = Sales & marketing costs / # of customers brought on board (within given time period)

Here’s where you can find CAC in Google Analytics:
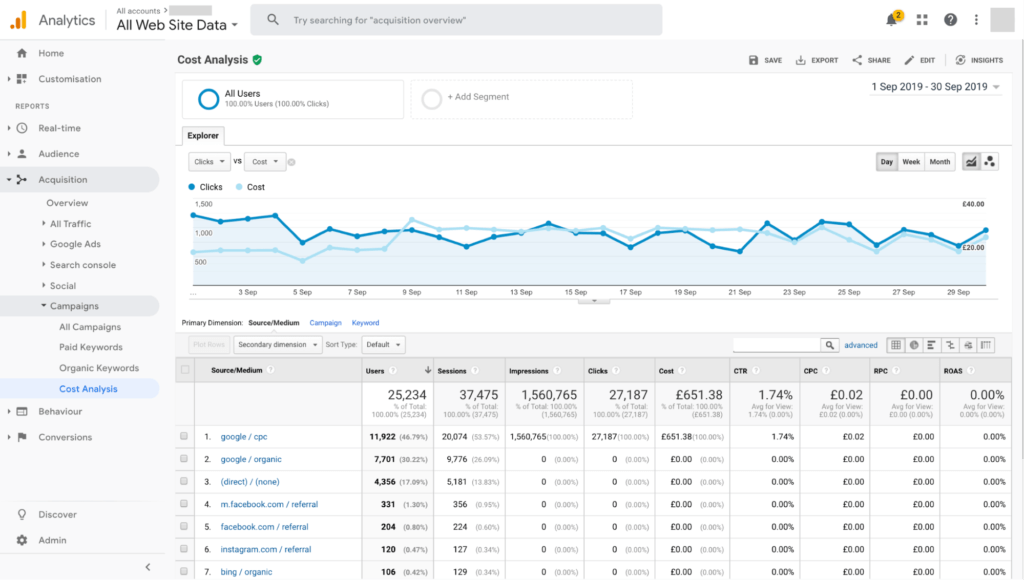
how-to-track-the-kpis that-matter_07

Example:

Alice runs a Shopify store that sells online accessories for women in their 20s. From January 2019 to July 2019, Alice spent $800,000 in sales and marketing (paid search, content marketing, team salaries, etc.).

During the same time frame, Alice sold 80,000 accessories on her store. Alice’s customer acquisition cost for that 6-month period is $10.


Related metrics that matter

Sales conversion rate on mobile/desktop

This is a vital comparison between desktop and mobile and which pages and products convert better on which devices. Typically, desktop conversion rates are more than double that of mobile.

However, average add to cart rates aren’t trailing by much. In fact, SaleCycle says the average mobile add to cart rate is 10.4%, just a few percentage points behind desktop’s 12.9%. What does this mean? In short, more shoppers are bailing during or around the checkout process. More on that later.

Average email signup rate

According to Sumo, the average email signup rate is 1.95%, with the top 10% of email marketers above a 4.7% success rate.

Average referrals from Facebook/Twitter

Referral traffic is how Google reports visits to your online store outside of “normal” Google searches. This includes “outside sources” like Facebook and Twitter, both popular sources of referral traffic.

When someone clicks on a hyperlink to visit a page on your store, GA tracks that click as a referral visit from the social media platform being used.


Tracking shopping cart abandonment rate

Why does it matter?

While it’s not music to merchant ears, abandoned online carts are an unfortunate reality of ecommerce. People are often indecisive, distracted or compelled to go another direction with their purchase decision.

In fact, about 77% of customers who add items to their shopping cart will navigate away from the store without completing their purchase, according to SaleCycle.

However, it’s worth noting that rates depend largely on industry and type of store — a big-ticket fashion brand may experience a higher abandonment rate than a protein powder brand, for instance. And among those nutrition products, those sold by subscription (where you ‘subscribe’ to get a box of protein bars every month, for example), tend to see higher cart abandonment but also much higher lifetime value.

While every merchant experiences some degree of cart abandonment (it’s just a reality of ecommerce), it’s crucial to minimise your rate and recover any abandoned carts.

That’s exactly where GA comes into play. Whether you’re looking at customer segments, locations or devices of use, you can investigate differences to find the main culprits causing your shoppers to say goodbye before purchasing.


How do you track it?

While there is a manual route to tracking cart abandonment in Google Analytics (setting up a custom funnel), Google has since simplified it quite a bit.

Within GA, not only can you track cart abandonments for both new and returning visitors, but you can also track overall shopping activity, basket additions, basket abandonment and checkout abandonment rates. Most importantly, these metrics reveal the hiccups in the buying process — where exactly does the buck stop in your customers’ journey?

Here’s where you can find these numbers in Google Analytics:
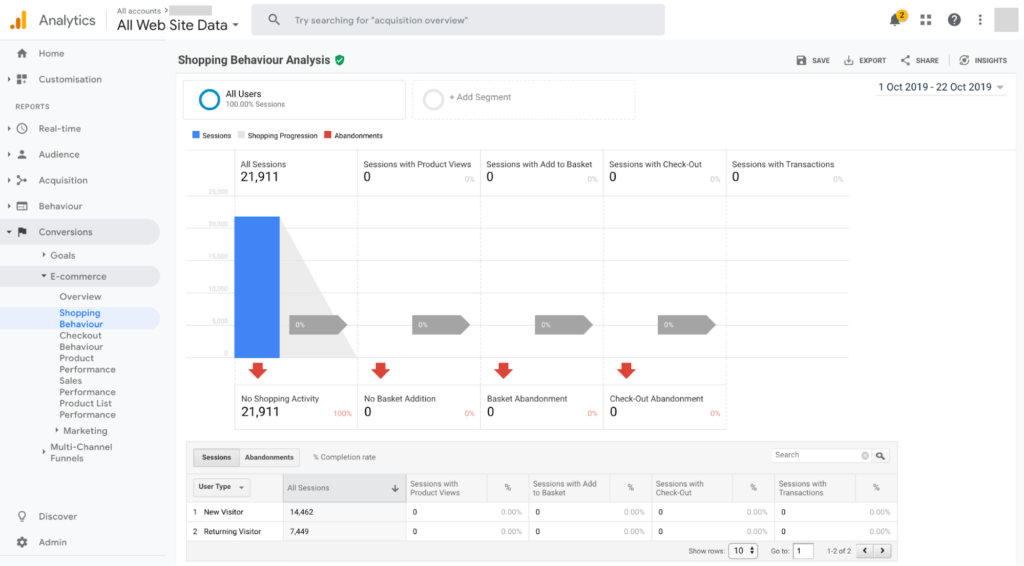
how-to-track-the-kpis that-matter_06

Related metrics that matter

Average pages per session

In August 2019, Littledata surveyed 3,623 sites and found the average pages per session was 3.0. If your site’s pages per session figure is between 1.8 and 4.7, you’re along the industry average. With less than 1.5, your store is underperforming.

Average sessions per user

A similar study found anything more than 1.7 sessions per user would put you in the 80th percentile of benchmarked sites, with more than 2.1 placing you in the 90th percentile. On the other hand, sessions per user of less than 1.2 would put you in the worst 20% of sites, with less than 1.2 placing you among the worst-performing sites.

Usage of site search

Google Analytics Site Search reports reveal the search terms users type, the pages where their search begins and the pages your search results page takes them to. With Site Search, GA offers helpful insights for your site content, store navigation and marketing campaigns.

Average product list CTR

Your average product list click through rate helps measure the customer draw and effectiveness of your product listings. Littledata also surveyed 265 stores in August 2019, finding that the average product list CTR was 1.7%. In other words, if your site has a product list CTR of between 0.8% and 4.7%, you’re within the industry average. then you are average compared with this benchmark.


Tracking product page load speed (zoom zoom)

Why does it matter?

With tens of thousands of online stores and growing competition, high consumer expectations are only getting more intense. Merchants have no choice but to meet those expectations (or fail out).

Especially with the recent dominance (and exponential growth) of mobile ecommerce and regular mobile transactions, shoppers expect pages to load quickly — or else. For many merchants, there’s always “the store next door” with comparable products, product values and consumer-friendly pricing.

In 2018, Pingdom measured their top 100 ecommerce sites against the 2-second load time (which is considered fast, but also an industry average for many sites). The result: 39% of the sites loaded within 2 seconds while 99% of the sites loaded in 5 seconds or less.

Pingdom did a nearly identical study three years ago, where 6% of their top 50 ecommerce sites took 5 or more seconds to load.

The conclusion: even with more data to support, sites are loading faster (especially on mobile) in order to measure up to shopper expectations.


How do you track it?

In Google Analytics, you can track page load speed for both your store product pages and your landing pages from the same place.

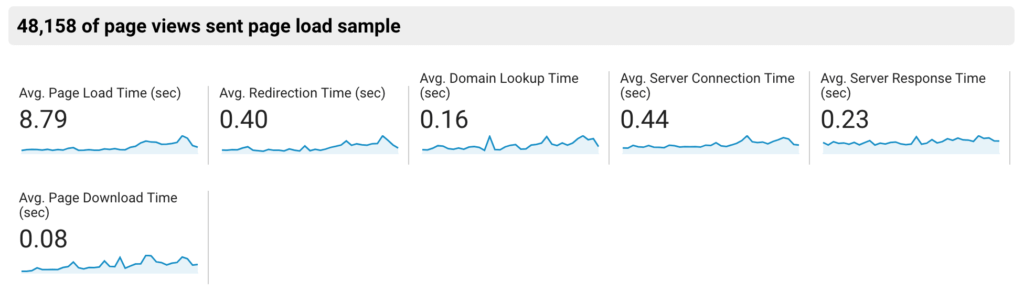
Under the Reports section, go to Behaviour > Site speed > Overview.
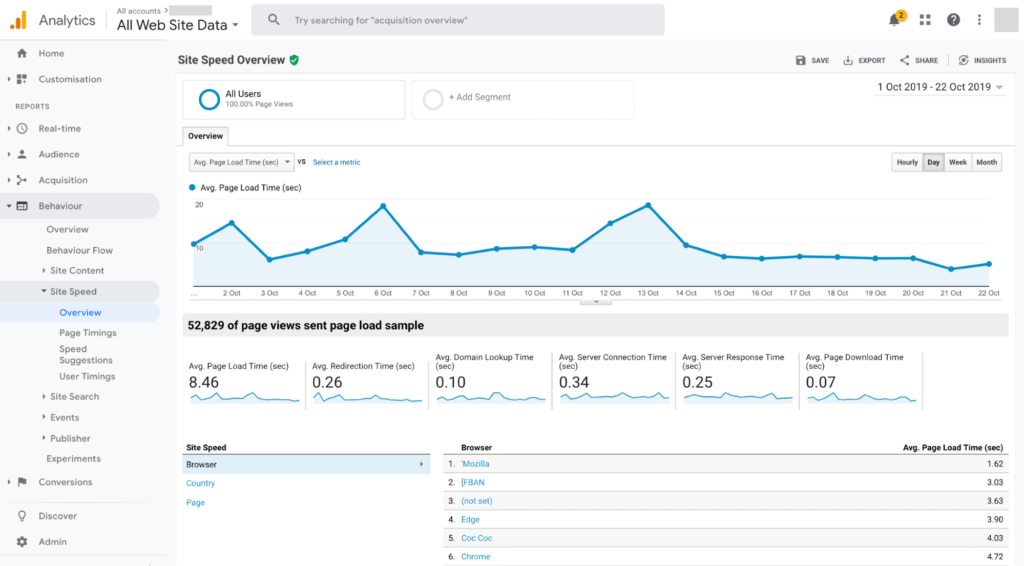
how-to-track-the-kpis that-matter_08

Here is some sample data showing the Overall view in GA:

Google Analytics also offers site Speed Suggestions, which allows you to compare pages side-by-side and analyze the pages that are lagging:
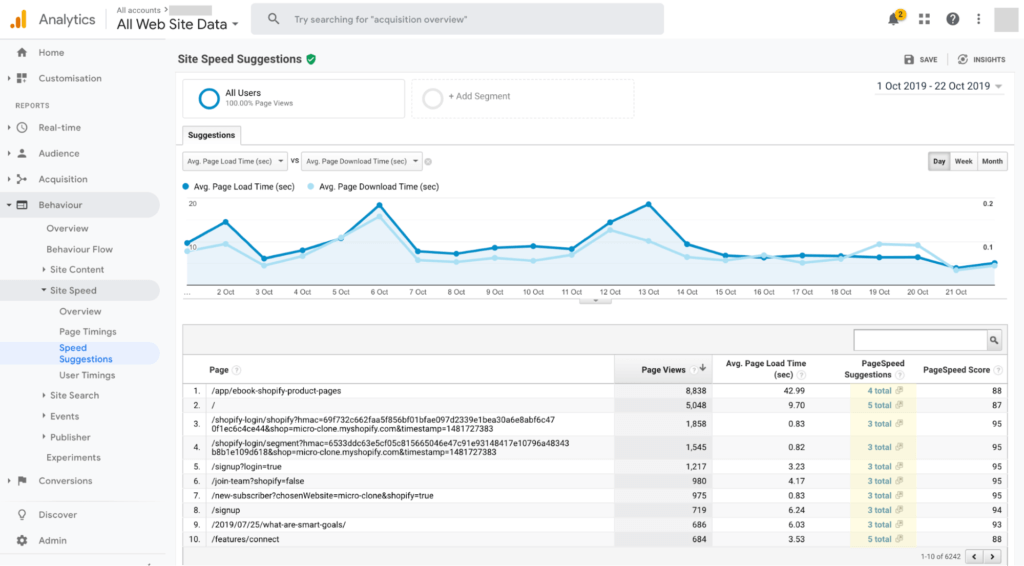
how-to-track-the-kpis that-matter_03

Related metrics that matter

Bounce rate from mobile/desktop google search

Littledata surveyed 3,315 sites in August 2019 and found the average bounce rate from mobile Google search was 50.0%. On the other hand, RocketFuel found the average desktop bounce rate is roughly 41% to 55%, with any rate over 70% being lackluster, regardless of the type of page (blog, storefront, etc.)

Bounce rate from email campaigns

Unlike website bounce rates, there are two different types of email bounce rates: hard bounces and soft bounces. The main difference is hard bounces go undelivered without ever being accepted by the recipient’s email server while soft bounces are accepted by the server.

Bounce rate from Google Ads/Facebook Ads

For paid search, an average Google Ads bounce rate for ecommerce stores is between 56%-70%. For Facebook Ads, an average bounce rate is about 41%-55%.

Other relevant metrics you can track under Site Speed include Average delay before page content, Average time before full page load on mobile/desktop and Average server response time (redirection time).


Tracking Average Order Value (AOV)

Why does it matter?

In short, Average order value (AOV) is the average amount spent by your customers when they place an order.

Not only is AOV the “north star metric” for Shopify stores (and most other ecommerce stores), but it directly boosts revenue, making it a top priority for stores of all sizes.

While boosting revenue often means merchants do everything they can to acquire more traffic, AOV offers a better strategy — convince your customers to spend a little more, therefore increasing your revenue without having to acquire new customers.

Simply put, AOV is one of the primary KPIs in ecommerce because it measures sales trends and reflects both buyer preferences and buyer behaviour — insights that can be used to optimise your storefront, product pages, marketing campaigns and internal decision-making. AOV helps you determine what you choose to sell and how you choose to sell it.

Since your marketing budget will go further as you increase AOV, this metric is also a great indicator of how much room you have to optimise ROI.

When you invest time thinking of new strategies to boost AOV with current customers, you’ll see better product sales and bigger profits.

Just like other ecommerce KPIs, be careful to not view this metric in isolation. Customer lifetime value, add to cart rate and checkout completion rate also come into play.


How do you track it?

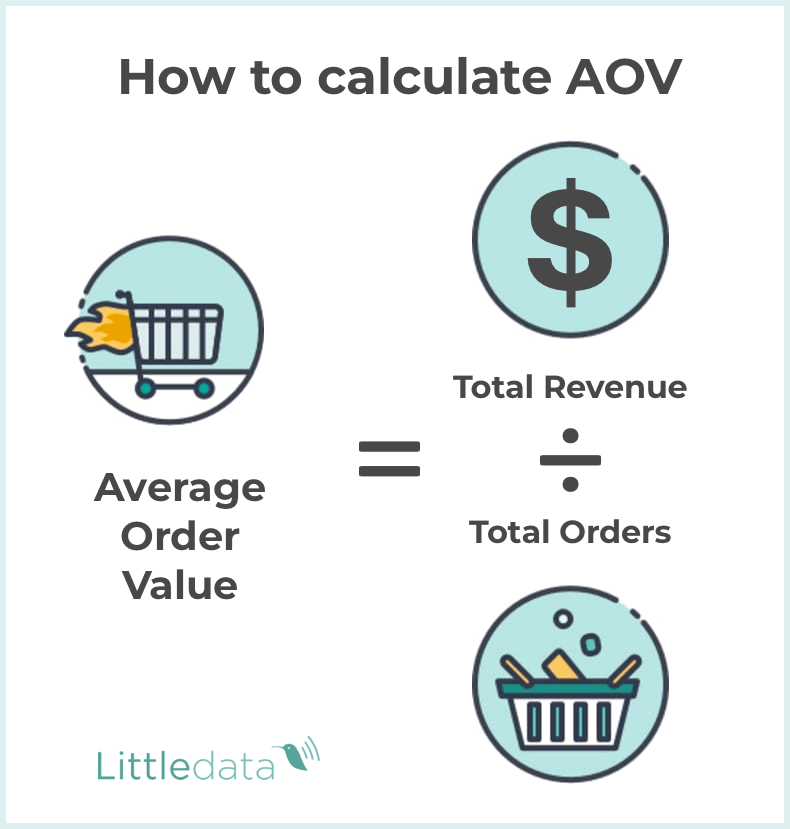
To manually calculate AOV, divide your total sales (over a given time period) by the total number of orders. Littledata’s graphic below illustrates the basic equation:
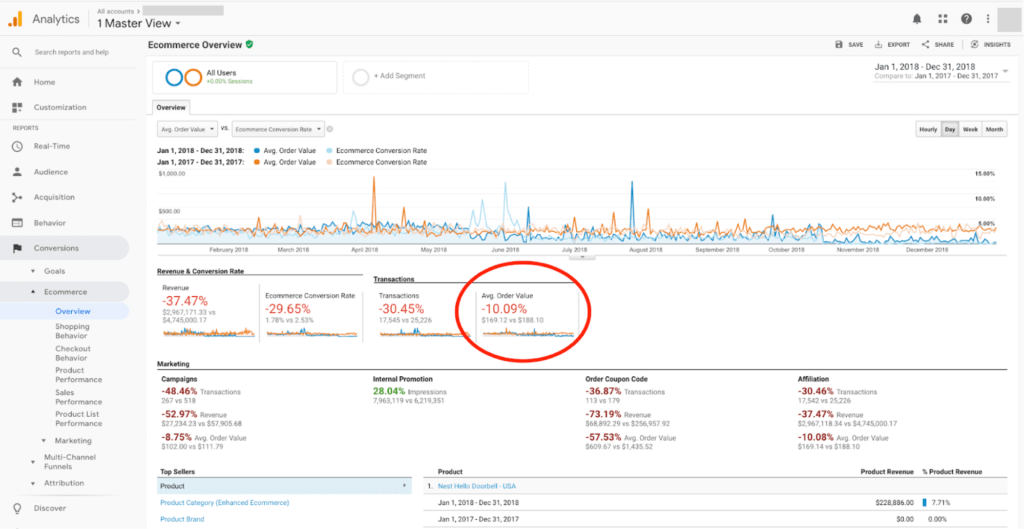
In Google Analytics, navigate to Reports, then Conversions > E-commerce > Overview. You’ll find average order value on the right hand side.
how-to-track-the-kpis that-matter_05

Related metrics that matter

Average add to cart rate

According to Smart Insights, the average add-to-cart rate is 10.9% (amongst their customer group), with the numbers slightly lower on mobile (9.4%) rather than desktop (12.5%).

Average checkout completion rate

In a recent survey of 509 stores, Littledata found the mean mobile checkout completion rate to be 41.4%, with an average performance range of 23.9% to 57.5%.


Customer lifetime value (CLV)

Why does it matter?

CLV measures how much each customer is worth to your business over the course of their buying life. Because every store sells different products at varying price points and in diverse markets, CLV isn’t a “one size fits all” metric.

In GA, many merchants gauge their customer value by using ecommerce tracking to measure their first order value. Unfortunately, this data misses a crucial detail by not taking into account how long those shoppers will continue to buy from your store (or subscribe, if you run a subscription store).

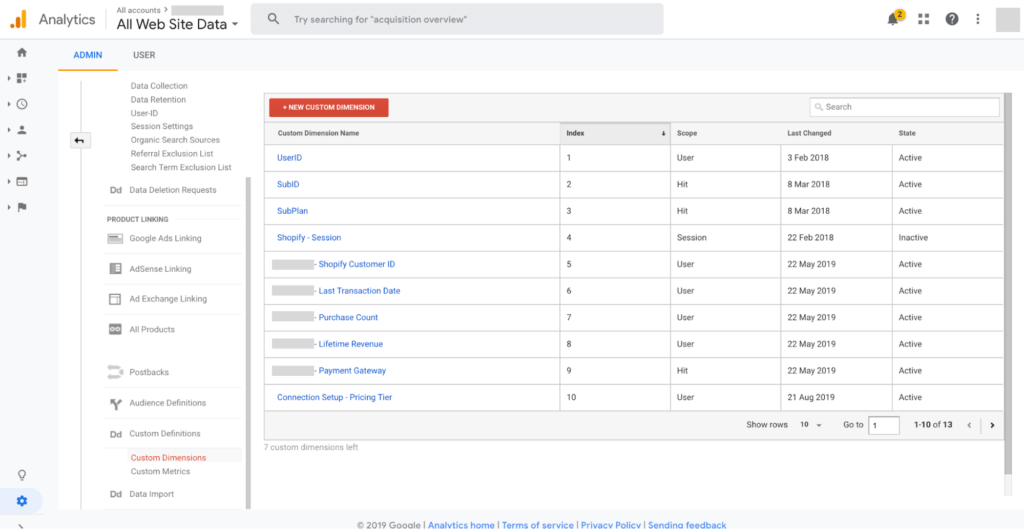
By segmenting data in GA with custom dimensions, you can ensure a proper analytics setup and know for sure your CLV is being accurately tracked. It also means you can target customer loyalty campaigns and discover new customers with lookalike audiences:
 

KPI strategies for different types of brands

Just as different types of metrics aren’t measured the same way, different types of purchases (one-off, first-time, repeat, or recurring) require different strategies to maximise profits — and different KPIs to track along the way.

Smaller catalog stores

For stores that run with only a handful of products (and typically rely on one-off sales), no metric is more important than conversion rate.

Calculating conversion rate is simple: just divide the number of purchases (from a given time period) by the total number of sessions. Many shoppers will take more than one session on your store to purchase, but this is the standard way to measure how effectively your store is converting shoppers into buyers.

Outside of Google Analytics, industry benchmarks can help you “take your temperature” in terms of your conversion performance. In September 2019, Littledata surveyed 1,127 stores found the average conversion rate was 1.4%.

This means that anything more than 3.1% would put you in the top 20% of stores, while a rate above 4.8% would put you in the top 10%.

On the flip side, an ecommerce conversion rate (on desktop, mobile or tablet) of less than 0.5% would put you among the bottom 20% of stores, and a rate below 0.2% would put you squarely among the worst-performing stores.

Using data to drive growth

Conversion rate is a live-and-die metric for stores of all sizes, but if you run a store without a diversified product line, you need to consistently track your store conversion rates — this includes conversions from individual product pages, click thrus and form fills on landing pages, and marketing campaigns, to name a few.


Larger catalog stores

The primary KPI with larger catalog stores is one we’ve already mentioned: average order value.

To maximize the chances of your customers spending more per purchase, encourage them to spend more during and after checkout.

The higher the AOV, the more income your store generates per order — it’s really that simple. Here are a few simple ways to boost AOV:

  1. Product bundles — offer several products in a “bundle” for a discounted price. PlayStation does a terrific job of creating product bundles with their gaming systems, controllers, branded accessories and even games to sweeten the cart for the user.
  2. Product upsells — persuade your customers to make an additional purchase (or to purchase something on your store with a higher price tag).
  3. Discounts on a minimum spend threshold — this isn’t nearly as complicated as it sounds. It simply means offering discounts that persuade your customers to spend more while making a purchase.  All you have to do is decide a minimum spend line for your customers that makes the discount available to them.

Using data to drive growth

Merchants with stores that often receive repeat purchases can drive growth by integrating PPC data with ecommerce data. The best way to do this: connect Google Analytics with the marketing tools you know and love.

For merchants that use Facebook Ads, you know it’s no fun to trudge through limited reporting to make endless spreadsheets.

GA smart connections such as Littledata’s Facebook integration help you automate your PPC data and show accurate ROI on Facebook Ads. Merchants can use tools like these to view Facebook campaign data directly in Google Analytics without having to switch between platforms or play guessing games (“which conversion rate is actually accurate?”).

For merchants who use Google Ads, another smart connection works similarly. By retargeting ecommerce segments and connecting online sales with Google Ads, you get consistent ecommerce data while viewing Ads costs, sales columns and reports — all within Google Analytics. Plus you can see that GA data in Ads to get a better sense for overall ecommerce performance.

Subscription stores

For subscription stores, churn is everything — it’s the lifeblood of your store. Churn determines how successful your store is and how long it takes you to scale.
The Churn Rate formula is calculated as the number of churned / the total number of customers: number of churned customers / total number of customers

Number of churned customers refers to how many people left your service over the period out of the total number of customers you had during the period. Churn isn’t a standalone metric, though — for subscription ecommerce, it has wild domino effects.

How does churn affect other subscription metrics?

Because churn acts as a mirror of the value of your products, you should constantly optimize your storefront (and products) to minimize churn. When the product is aligned with your perceived value, your churn rates will (in theory) drop.

The metrics that churn primarily affects are recurring revenue, customer lifetime value (CLV), and customer acquisition cost (CAC):

  • Monthly recurring revenue: when your customers leave, so does a part of your expected revenue. For ecommerce businesses, monthly recurring revenue (MRR) is 1) what keeps your company alive and 2) the main indicator of long-term viability. Churn hurts revenue, so it directly affects MRR=.
  • Customer lifetime value: the CLV of your customers offer a strong prediction of the profitability and longevity of your store. When users leave, the prospective value or revenue goes unearned, therefore decreasing CLV.
  • Customer acquisition cost: churn increases your average CAC. If you are doing everything possible to reduce churn, you can quickly get back a lower CAC from your users.

Using data to drive growth

For subscription stores, affiliate marketing tools like Refersion can help you track and improve promotions.

By tracking details such as on-site search and product list views within Google Analytics, you can gauge the interest level of buyers and design retargeting campaigns tailored to their online behaviour.

In fact, Refersion connections like this one help you get specific with this type of larger catalog data — which product pages repeat visitors from affiliate campaigns are going to (and how this compares to industry standards).

ReCharge is another game-changing tool designed specifically for subscription-based stores. As the most popular recurring billing solution for Shopify and Shopify Plus, ReCharge helps merchants sell subscriptions easily and smoothly.

ReCharge’s feature set also allows for a variety of subscription types, including single product, mixed cart & entire cart subscriptions.

Keeping in mind those essential metrics like product list views, ecommerce managers for larger-catalog brands can dive into CRO strategies based not necessarily on more detailed views of products but also on less detailed views — the KPIs that come from zooming out as much as zooming in.

By looking at product category performance such as product list views by category as well as product details such as product color and product size, you can make seemingly small changes that lead to big leaps in revenue.


Thinking into the future

As online retail and shopper expectations continue to balloon, it’s crucial for merchants to have a firm grasp of their data.

To that end, Google Analytics offers something no other data platform can — full capability to bring in data from other platforms, ensure its accurate, and help turn it into actionable insights.

With GA’s robust reporting system, custom features and segmenting tools, it’s simply a better choice for merchants who want to scale their store faster. But it begins with tracking the KPIs that really matter.

Happy tracking!


Article for Bluestout.com by Littledata


The post How to track the KPIs that matter in Google Analytics appeared first on BlueStout.



from Blog – BlueStout https://ift.tt/3dvNPpE
via IFTTT
Retention Teardown: MeUndies $75 Million Strategy

When I was a kid, I never would have imagined that my dream job would entail writing about undies, but here we are. And boy am I excited to dig into this one.

As we should all know by now, retention is the name of the game for successful ecommerce stores. Whether you’re running a subscription program or selling single purchase products, the brands finding success are working their butts off to bring customers back again and again.

To build deep, meaningful customer relationships that stand the test of time, and extend customer lifecycles as far as they can.

It’s a game of retention, and MeUndies is winning. $75 Million winning.

Today, we’re going to assess MeUndies’ framework for retention to uncover how they continue to succeed in today’s subscription economy.

We’ll look at 6 key areas: Products, community-building, vision and values, flexibility, email engagement, and exclusivity. Let’s see how MeUndies stacks up (spoiler alert, it’s all good), and what you can learn from this subscription mastermind.


When did Undies become Fundies?

Launched in 2011, MeUndies had a unique approach to the marketplace and started as a subscription service. This subscription allowed them to deliver a unique experience to their customers that blended surprise, convenience, and quality all in one.

Now, MeUndies also offers a la carte items such as lounge pants, socks, dog bandana, and more to serve a different kind of customer. Although their subscription still accounts for roughly 50% of their revenue.

According to Jonathan Shokrian, Founder of Meundies, the company has now sold over 10 million pairs of underwear and is projecting to end 2019 with at least $75 million in annual revenue.

That’s some serious success. And so much of it is based on MeUndies’ ability to not only acquire customers, but create long-standing relationships with them.

From their high-level vision all the way down to technical bits of the experience, MeUndies has retention and community in mind. So let’s check out their retention playbook.


1. Exceptional Product Experiences

I’ll cut straight to it: MeUndies products are super high quality (I own both the socks and undies), fun, and hold up to the price point.

What’s unique about MeUndies product is its ability to evolve with current trends. Because they consistently release new prints, they can stay relevant to what’s happening within the lives of their customers (hello, retention gold).

As their customers lives and interests evolve, MeUndies can evolve with them, too. Providing timely and unexpected experiences with the brand.

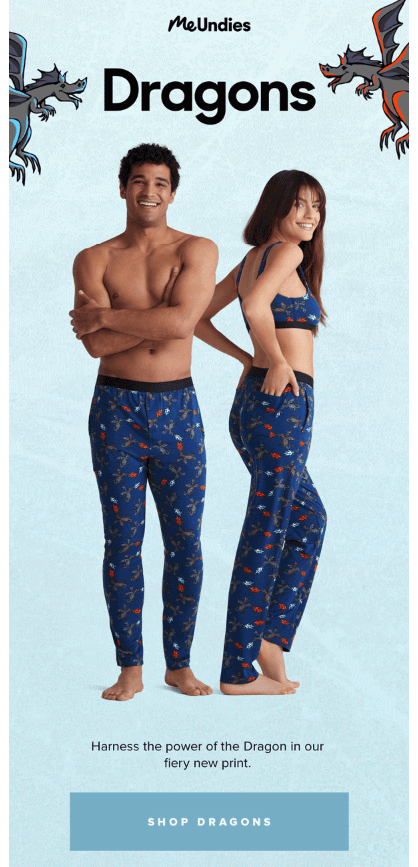
For example, leading up to the 8th and final season of Game of Thrones, MeUndies cleverly released their Dragon print.

ecommerce-retention_Screen Shot 2019-09-10 at 11.22.45 AM

This evolving product also acts consistent customer data to fuel future releases. MeUndies can follow trends on what customers really want, what they get excited about, and what they are most likely to purchase, increasing not only LTV, but even AOV as well.

And, it allows the brand to take a passionate stance on cultural movements. Like they’re recent pride campaign with Griz:

Now onto the delivery experience. No matter what products you are shipping, there needs to be some “unboxing” feeling to it.

Remember: If people were just looking for a 5 pack of any underwear, they’re going to order from Amazon. Products in a box.

But if they’re coming to MeUndies, they’re looking for something more. And MeUndies does a great job of doing this (and has lots of room to play with new ideas).

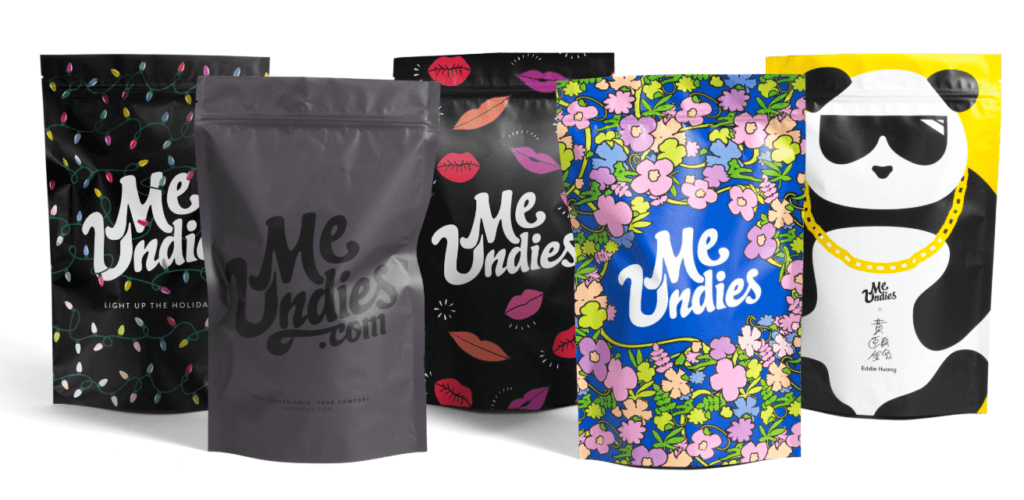
The packaging is bright, fun, super on-brand, ever-changing,and gives you that “Ah! My package came!” feeling right away.

(Plus, it can spark some pretty good convos with your mailman. I speak from experience.)

ecommerce-retention_Screen Shot 2019-09-10 at 11.28.20 AM

Image Source

Great products (with great feedback loops) + exciting delivery experiences are major contributors MeUndies success with retention.

For deeper insights on unboxing, I highly recommend checking out Lumi’s Youtube channel.


2. Commitment to Community

It’s 2019. By now, I can just about guarantee that every single person who reads this post has bought something online. Online shopping is no longer new and noteworthy, which means digitally native brands have to bring more to the table.

Essentially, you have to become larger than the products you sell or the convenience of your site.

You need to become larger than life.

MeUndies built an entire community not only around their products, but their mission as well (see above). This community is where Meundies’ success truly derives from.

For Example, the MeUndies instagram has 345k foollowers and the hashtag #meundies has been used 22,000 times.

That’s twenty-two thousand happy customers providing MeUndies with organic, free marketing. And we all know how powerful word of mouth is.

MeUndies has worked very hard to build this community, and they prove their dedication to it again and again on Instagram.

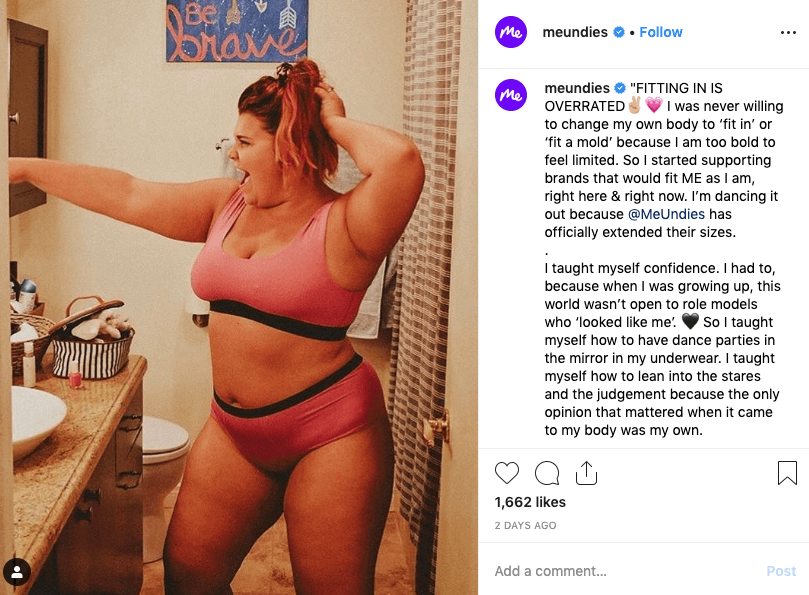
From sharing real, honest pictures and stories from their fans….

ecommerce-retention_Screen Shot 2019-09-10 at 9.47.19 AM

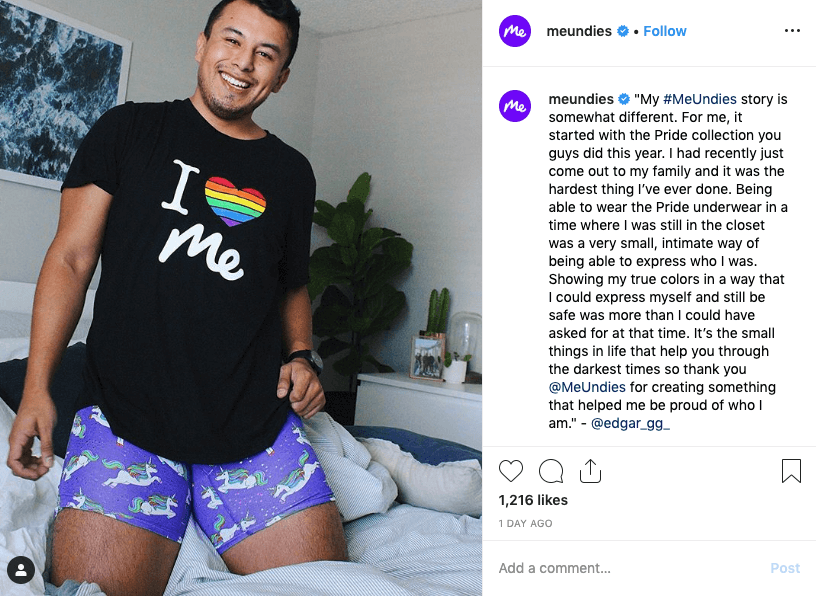
To celebrate the people who are truly living out their mission….

ecommerce-retention_Screen Shot 2019-09-10 at 9.47.36 AM

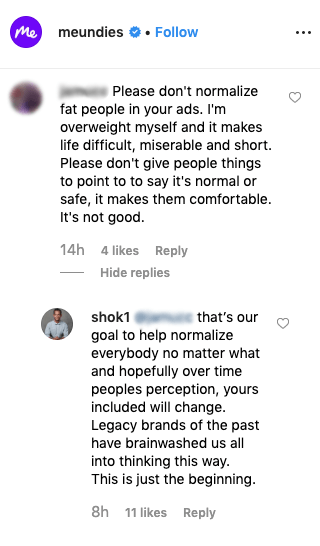
To this… MeUndies Founder directly defending his community, vision, and values where his customers are engaging.

ecommerce-retention_Screen Shot 2019-09-10 at 9.49.38 AM copy

On top of all of that, they are providing their community with valuable ways to keep the brand front and center in their lives.

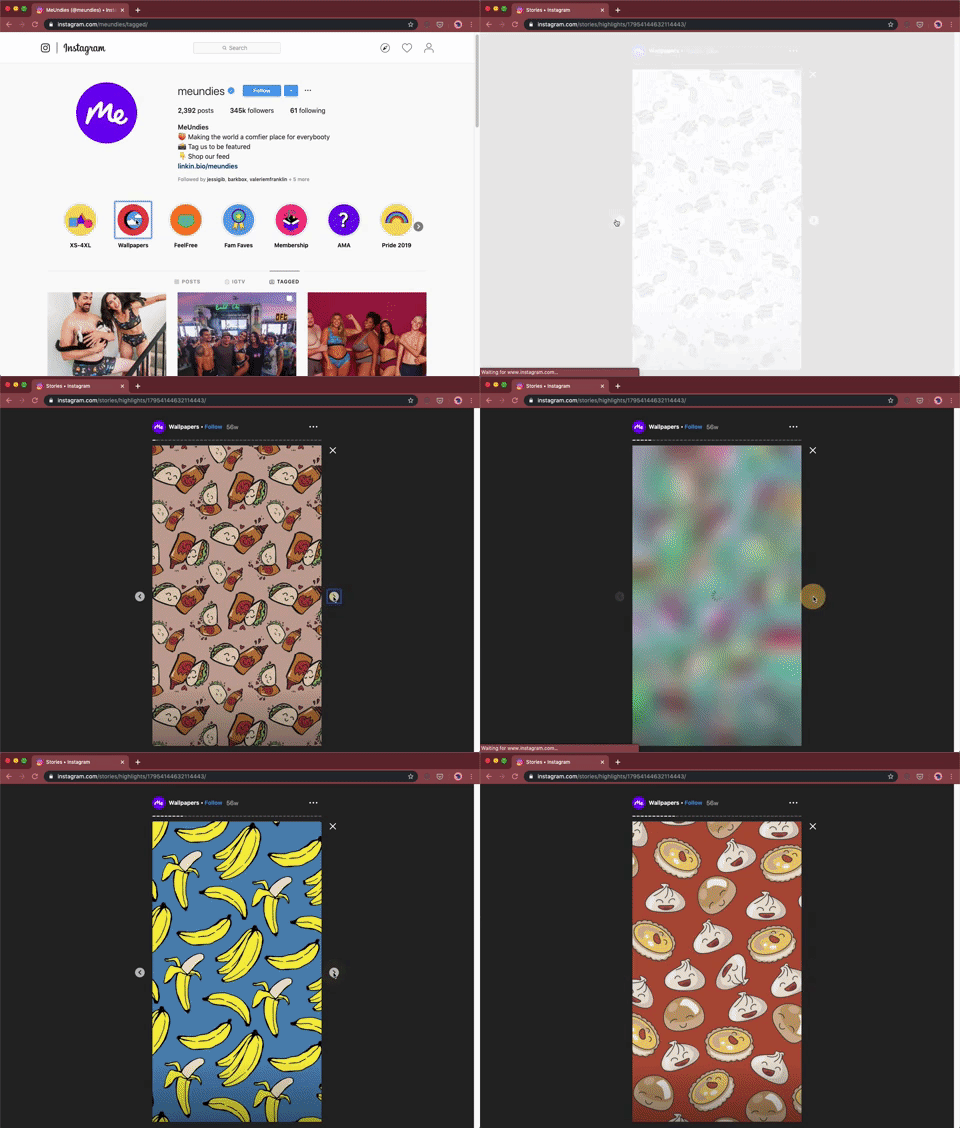
Here’s my favorite little trick: Each new underwear pattern they release is also released as a phone wallpaper. They’re adorable, they allow fans to bring the style and brand into their most treasured space (smartphones), and provide organic reach to new customers as well.

Also, this is super simple for the MeUndies team, but provides a deep level of value and dedication to the customer.

At the end of the day, yes, this is all still commerce. MeUndies is trying to make more sales.

But it’s become commerce that doesn’t feel transactional. It’s relational.

The community aspect of MeUndies continually drives sales, repeat purchases, subscription activations, extended LTVs… but most importantly, it continues to drive a deeper connection with their customers.

Meaning, when their customers’ lives change, MeUndies doesn’t need to go searching for a new customer base. They can simply change with them.


3. Dedication to Vision & Values

I’m constantly doing brand teardowns, and the thing that truly makes brands stand out is often their dedication to vision and values.

Customers want to share values with the brands they buy from. They want meaningful, deeper stories behind the products they buy.

MeUndies may just be one of the great pioneers in this brand shift. MeUndies saw a hole, not just in the market, but in the experience of buying underwear and honed in on that.

Their mission? “To inspire confidence and individuality through fun and comfortable underwear, because when you feel good, anything is possible. It’s almost about redefining what sexy means.” –Bryan Lalezarian, CEO of MeUndies

This mission is one that resonates with millions of people all around the world. That larger vision is ultimately what makes MeUndies way more than a company selling fun underpants online.

Consumers flock to MeUndies to feel something bigger than a new pair of undies. They come for the community, the support, the validation.

They come because MeUndies promises to really see you exactly how you are.

You don’t need to live up to a beauty standard to fit into the style (see: Victoria’s secret) or have unnaturally chiseled abs to be comfortable in your briefs (see: Calving Klein).

“We just want people to aspire to be exactly who they are.”

So the mission is incredible, but the dedication to it is where MeUndies really thrives.

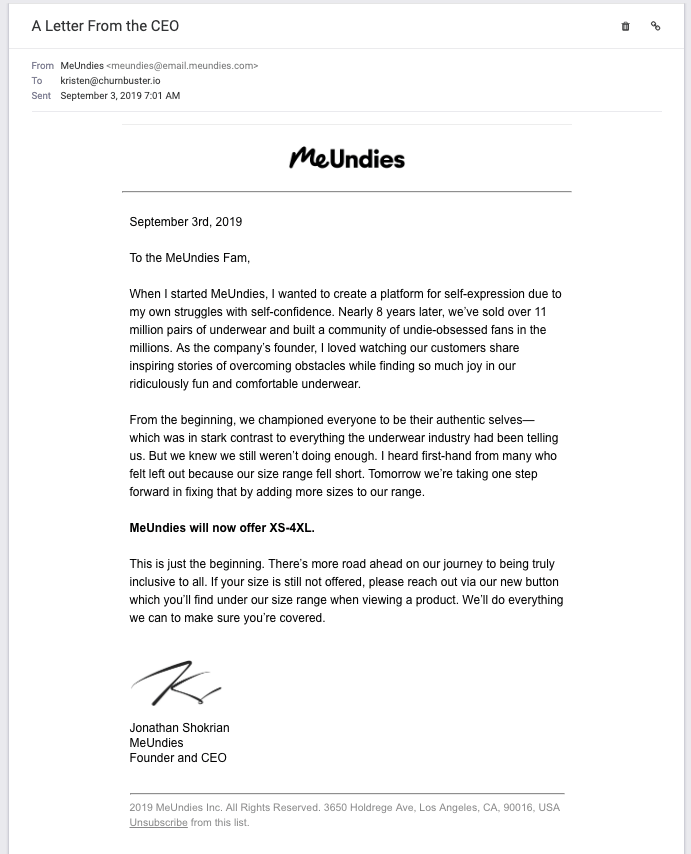
From emails like this from Shokiran himself….

ecommerce-retention_MeUndies CEO

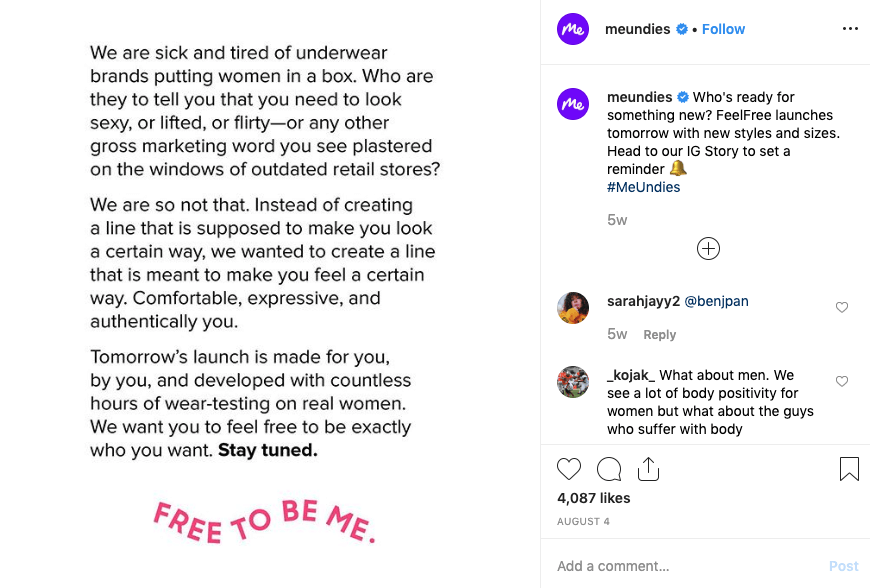
To ads truly honoring their values…

ecommerce-retention_meundies-true-color-fund

To genuine reinforcements of that vision….

MeUndies hits on this mission again and again with their customers. And because they do this, the brand connections become deeper and the brand loyalty skyrockets.

Why would you leave a company that not only provides a necessary item, but makes it fun, encouraging, and inviting as well?


4. Subscription Flexibility

Customer experience is something I harp on again and again when talking with eCommerce companies.

When you’re selling products on subscription, allowing that subscription to ebb and flow with your customers’ lives is absolutely imperative.

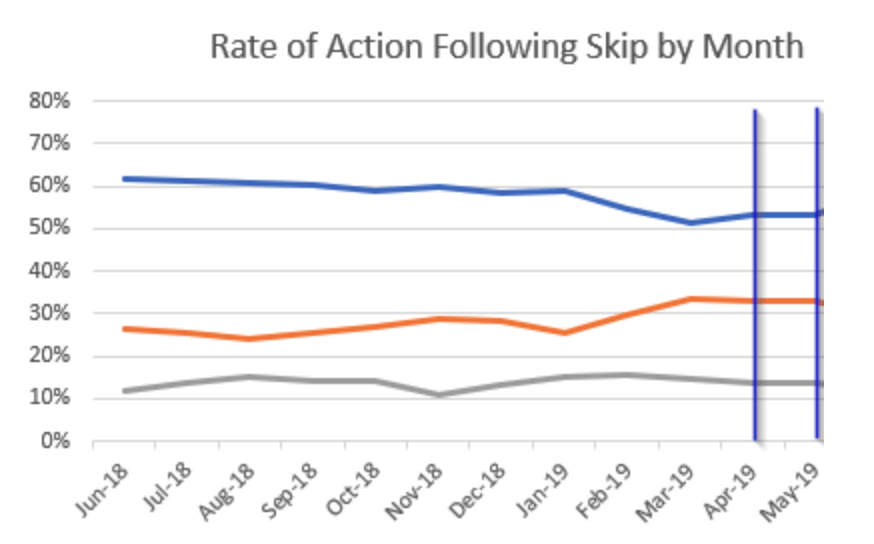
Skips and delays may sound like a game of chance, but data shows people who skip have a 60% likelihood of processing on the next renewal, about 30% will skip again, and only about 10% will end up cancelling.


ecommerce-retention_rate-of-action-graph


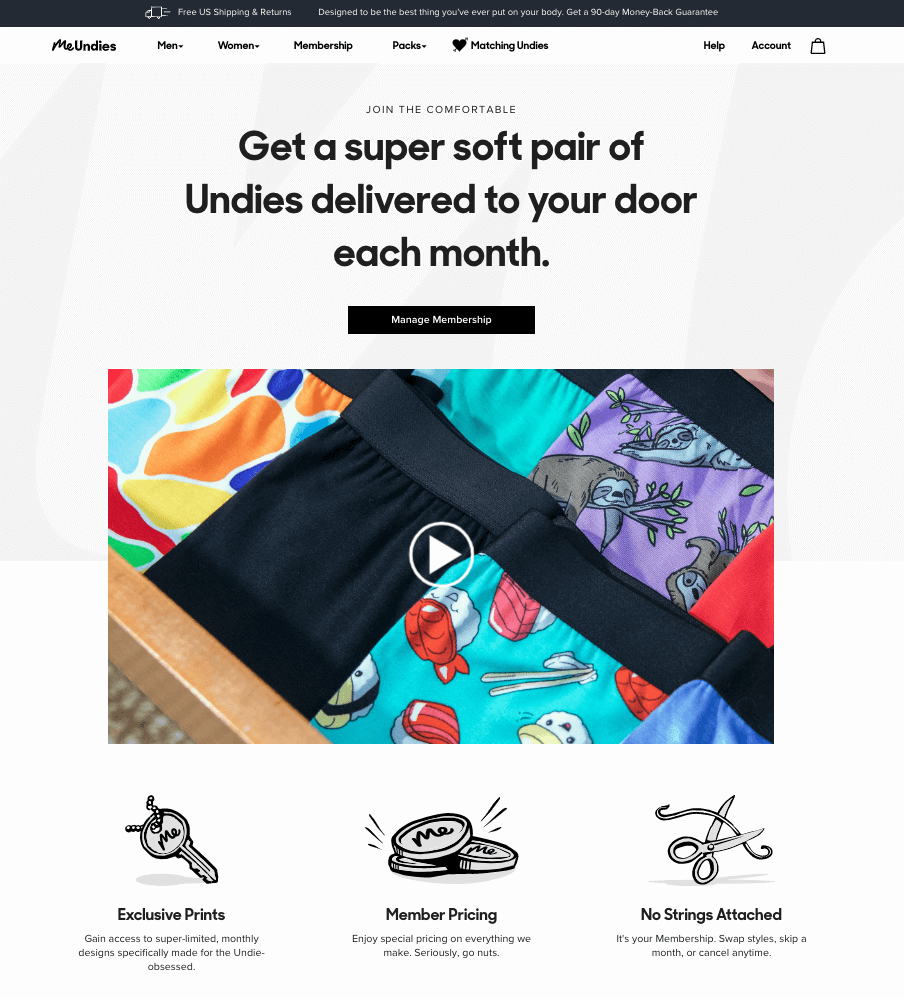
MeUndies customers can quickly sign in, change sizes or colors, add or delete items, and even skip or cancel memberships all together.

This makes it so easy to remain a customer on the membership. My only suggestion to the MeUndies team would be to make the skip a month option easier to find/access for the customer.

Remember, it’s all about keeping the subscription active, even if that means allowing for it to pause and skip.

Use a tool like GetARPU to make this extraordinarily easy for your customers.


5. Engagement in the Inbox

Every single time a customer comes in contact with your brand you should be delivering a great experience. Which means you have to look at the entire experience, from the broad overview down to specific customer communications.

For MeUndies sake, we’re going to be looking at some specific email touchpoints that MeUndies is rocking.

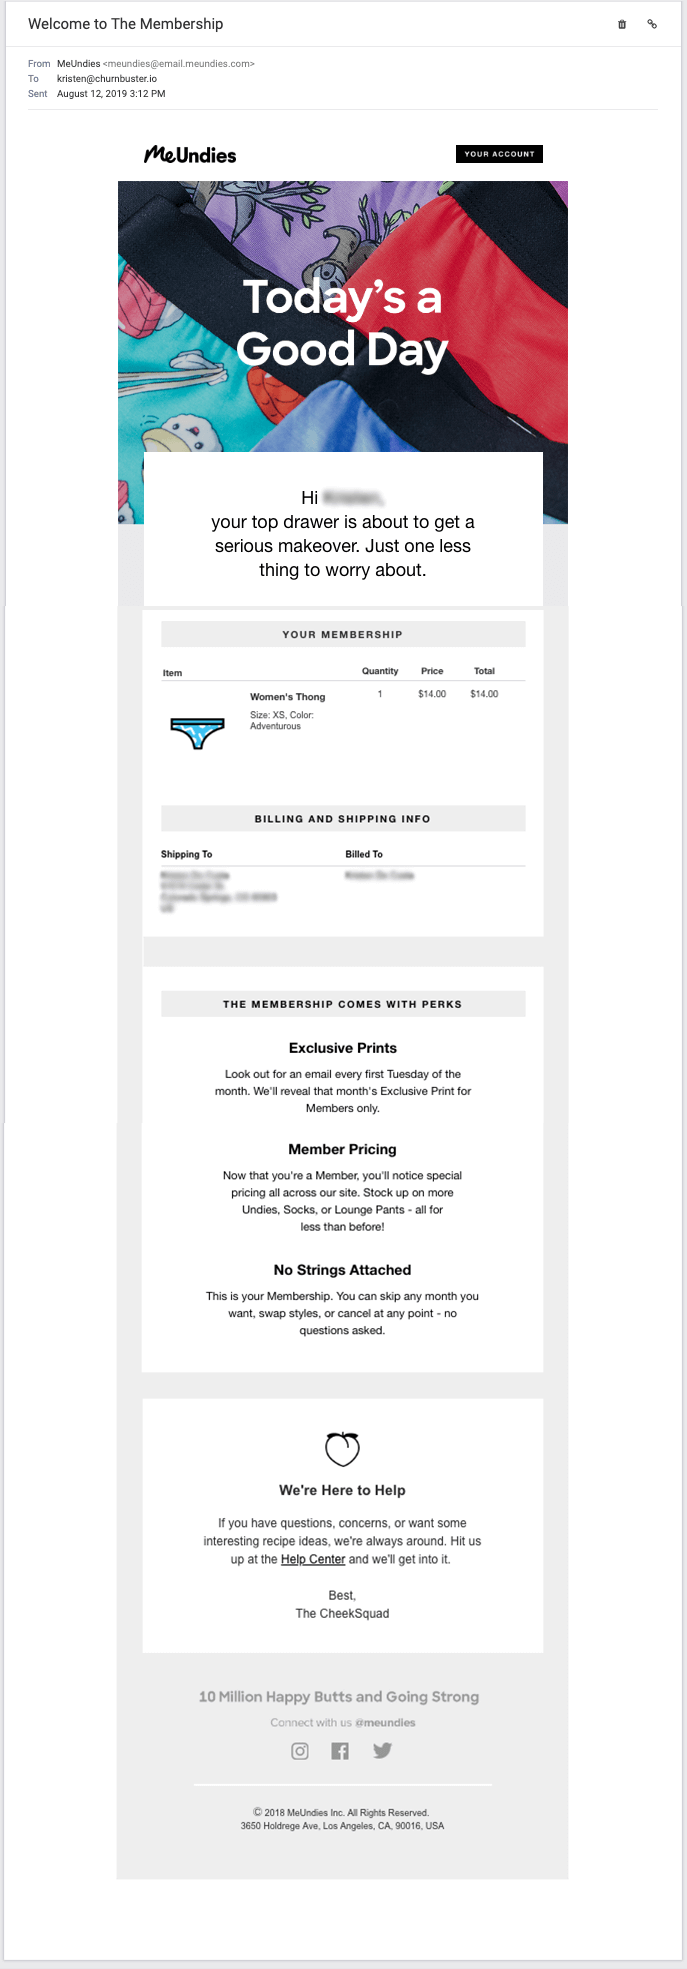
1 – The welcome email

From the get-go, you want to set up the customer experience to be wonderful. The welcome email is the very first email your new customer gets.

In MeUndies case, it’s a welcome to the membership.

MeUndies kills it here with a cute opening note, clear branding, great imagery, and everything the customer needs to know about the recent order and the upcoming subscription. 

It addresses every concern, question, or insecurity all wrapped up in one beautifully delivered message.


2 – Dunning emails

Failed payment recovery campaigns is where most eCommerce brands really fall short in the customer experience (even Chewy isn’t that great at it).

But it’s a pretty dangerous place to neglect the customer experience. If you don’t believe me, believe MeUndies. They’ve clearly invested in these campaigns. 


Remember that keeping the subscription active is your #1 priority, so don’t risk a passive cancellation simply due to untrustworthy, off-brand emails with poor customer experience.

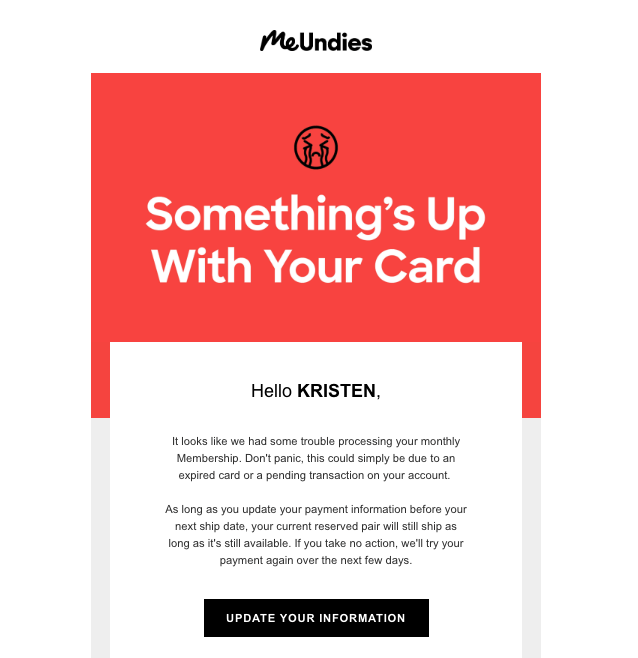
Take a look at this dunning email from MeUndies:

ecommerce-retention_Screen Shot 2019-09-11 at 9.57.29 AM

This email is clearly coming from MeUndies (based on branding, template, and tone) so the customer knows this is a valid request. 

It keeps things lighthearted, directs the customer exactly where they need to go, and keeps the brand experience positive. 

These emails can be really tricky to master. Here are some dunning best practices. See how your emails stack up, there’s no reason to risk churn at this volatile customer moment.


3 – Customer Feedback:

This is another area I see many eCommerce and DTC companies falling short: gathering authentic customer feedback (and doing something with it).

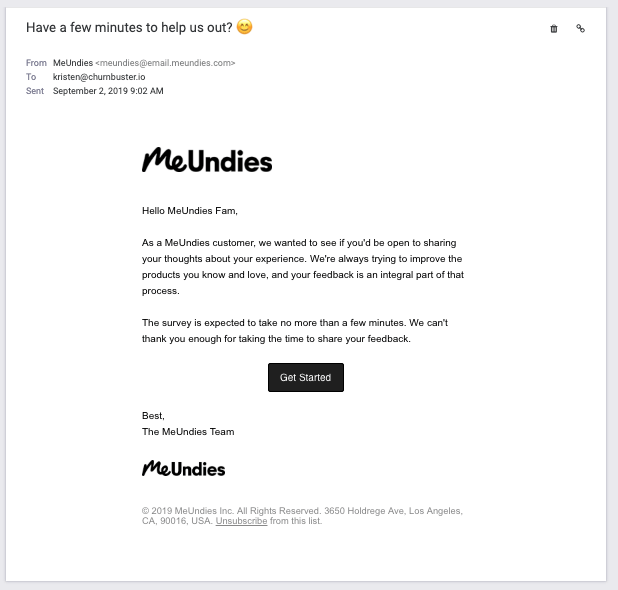
We’ll dig into this more in the next section, but this email shows the customer how dedicated MeUndies is to truly providing an experience and product that their customers love (and want to continue to buy). 

ecommerce-retention_MeUndies Feedback

Bonus: MeUndies actually does use this feedback to inform future product launches, campaigns, and engagement strategies. *chef’s kiss*

Email is one of the best ways to consistently engage and retain your customers. Here’s a list of 9 more retention emails and examples from top companies (and of course MeUndies made this list).


6. The Exclusivity Factor

I saved this one for last because it’s one of the best retention tactics MeUndies has pulled out of their hat in the last few years.

Although they began simply as a monthly underwear subscription, they have since turned that subscription into a membership program. Hear why directly from TJ Stein, VP of Customer Experience at MeUndies.

Now when a customer opts in for the subscription, they are actually opting into so much more than a monthly delivery. With the membership model, subscription customers get a new level of exclusivity and value from MeUndies.

In exchange for signing up for monthly orders, MeUndies members pay a cheaper price for their underwear (for women, $14 a pair as opposed to $18), get first access to new products (also at a discount), and access exclusive prints just for members (released monthly).

Even more than that? They add a real emotional and aspirational pull to the membership.

The way I see it, MeUndies customers are drawn to the membership for a few reasons:

1 – To save money!

It simply makes sense financially. Why pay $18 on underwear when it could cost $14? If I don’t like them, I’ll cancel.

2 – To feel special.

We all want to feel like VIPs. This is what a membership hones in on. MeUndies prints are exclusive and highly sought after. If you’re a member, you’re first in line.

It’d be like breezing past an entire line outside of the club, winking at the bouncer, and strutting right in through the red velvet rope. *Beyonce style*

3 – To be seen.

We all want to belong. MeUndies membership allows people to be welcomed, seen, appreciated, and if they’re lucky, even featured on MeUndies social feed.

4 – To be heard.

Life moves fast, society changes everyday, the newscycle is 24/7. Sometimes, we just want to be heard.

MeUndies encourages their members to provide feedback and thoughts on the product and the brand direction. MeUndies not only hears their members, they enact change based on those opinions.

Adding this layer of membership atop a subscription opens up so much potential for driving deeper customer relationships, gathering customer data to improve future releases, and guiding the company’s decisions.

According to Shokrian, members account for half of MeUndies customers, and spend three times as much overall as non-members.

That’s the power of building deep customer relationships. MeUndies is not just a brand selling underwear to their members, they’ve become genuine, close friends with their members.

And it’s a lot harder to cancel a friendship than it is a simple subscription…


MeUndies in Brief

See what I did there? 🙂

MeUndies continues to impress me with their dedication to their values, mission, and customers. They are a truly customer-centric company.

Think about it this way: MeUndies isn’t selling some new and innovative products. They’re selling a new and innovative experience. And there’s a little piece of their playbook every single eCommerce company can snag.

Hone in on your values. Become larger than life. Delivery quality products with an abundance of customer surprise, delight, and engagement. Build a community of raving fans. Develop personal relationships with customers, allow for flexibility, and focus on every single detail in the customer experience.

10/10 stars for MeUndies retention.

What impresses you the most? Let me know in the comments below or tweet directly at me.


ABOUT THE AUTHOR

Kristen is the lead on all things education, retention, and community-related at Churn Buster. She’s obsessed with creating meaningful customer relationships and showcasing the human side of eCommerce businesses.

Kristen has worked with hundreds of top companies (including ButcherBox, LOLA, and Four Sigmatic) to improve MRR and build deeper connections with their customers.

The post Retention Teardown: MeUndies $75 Million Strategy appeared first on BlueStout.


from Blog – BlueStout https://ift.tt/39FitKS
via IFTTT

New Government – Labour Small Business Agenda

We’ve are all waking up to a new Government today, with the Labour party about to take control of the country and what should be top of your...