The surprising reality of eCommerce PPC is that maximizing the return on ad spend (ROAS) does not always maximize profitability.
When products share the same margin, optimizing for ROAS is easier to calculate. i.e. One divided by the product margin = your target break even ROAS. Then, you can focus on growth from there (unless you’re also factoring in LTV, which you should).
When multiple products have different margins, ROAS is not necessarily the best metric to focus on. Organizing your ad performance by different data points beyond ROAS can help you discover unique opportunities for profit maximization.
For example, eCommerce companies that use Google Ads have many bid optimization levers available such as:
- Devices
- Audiences
- Geography
- Demographics
- Day of the week
…and many other relevant data points.
Of course, you also have the standard KPIs associated with pay-per click (PPC).
- Cost
- Clicks
- Conversions / transactions
- Revenue
If you can correlate all these data points to profit in Google Ads campaigns, you’ve enhanced your ability to optimize toward more profitability.
Our experience with data analysis like this has shown that Google ad campaigns should target the best performing products and layer in as many bidding levers (or “segments”) as possible to optimize that targeting.
In this eCommerce PPC data analysis case study, we will show you how this process of connecting the data between Google Analytics, Google Ads, and unique business stats resulted in 72% more transactions at an 8% increase in spend year over year.
Note: If you want to find profitable opportunities in your data, our Google Ads and Social Media PPC experts would love to help. Get in touch here.
Background: Increasing ROAS ≠ Maximized Profitability
The first step before starting any PPC campaigns for our clients is to understand their business as much as possible. In particular, the past and current marketing efforts, performance, and potential of their different products.
The goal of this is to identify which Google Ad strategies are actually profitable (whether or not they are generating a high or low ROAS) and maximize those. As well as to identify which strategies are not profitable (again, whether or not they have high or low ROAS) and minimize those.
In this client’s case, understanding how their business works first meant becoming familiar with how every one of the 500-600 products they sell has a product margin that changes in real time. Next, was finding a way to get that data incorporated directly into their marketing campaigns.
The challenge was figuring out how to incorporate their backend performance data (each transaction and product had varying margin data) and be able to calculate what ratio we needed to hit to break even or be profitable. Essentially, each transaction could theoretically have a different net profit. We needed to find a way to bake this data into our analysis for optimizing the account.
That meant looking at ROAS alone wasn’t going to cut it. Instead, we needed to marry their data tracking capabilities with our Google Ad performance data to calculate the actual ROI. The goal being to get as granular as possible so we could take advantage of our standard bid optimization segments, at a minimum.
Once we did, we had a clear view of how the profitability of the campaigns was an independent figure from their ROAS (calculated by conversion value / cost).
What does it look like? Here is a campaign level screenshot that compares our Test ROI metric (Profit / Ad Cost) to ROAS (Conversion value / cost). Note that the first four rows have a similar ROI but the ROAS ranges greatly from 3.72 to 6.72:
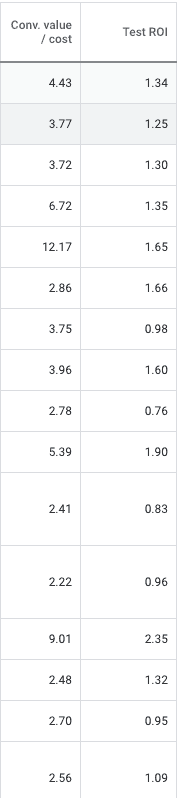
There were many many iterations before getting to the above chart, which now lives in Google Ads.
Doing this type of analysis on an ongoing basis, in a way that would provide usable and actionable data for multiple types of optimizations, proved difficult. There were data processing capability restrictions and inconsistencies in how the different analytics platforms in use reported results, which meant we had to cross check every data point (over…and over…and…over).
We needed to know that these data points were accurate to get a real look at the profitability of each:
- Product
- Campaign
- Ad group
- Keyword
- Search Query
- Device
- Any segment you would traditionally use to optimize targeting
We started with figuring out how to collect that data, then analyze it to make decisions based off of it in a timely manner. This was the “data science” applied to create a data driven PPC campaign.
Again, this would allow us to maximize the return from the most profitable campaigns (the “golden nuggets”), and mitigate the loss from the least profitable campaigns.
Work: Finding Golden Nuggets with Analytics Auto-Tagging
A couple of the questions we needed to answer with the clients’ data had to do with user behavior data:
- What campaigns do people come to the website from?
- What do they end up purchasing?
- What profit did the purchase generate?
- How does that profit data correlate to key targeting segments such as search query, device, audience segments, demographic segments, etc?
In other words: Based on the final purchase each user made, what was the profit from the final transaction (people don’t always purchase what they search for) and how can we distribute that profit across keywords, search queries, products and every segment we can cut up the data with.
Note: You can use Google’s Enhanced eCommerce tracking to collect transaction and revenue data from your eCommerce store. It also tracks user behavior data such as product impressions, checkout or cart abandonment, transactions, refunds, etc.
One of the first things we tried was to set up a customized analytics report outside of Google Analytics to pair transaction ID’s with margin and profit. By using the transaction ID as our key unique identifier, we were able to create reporting segments for campaign, ad group, keyword, search query and product, which we then further segment by device. This got us granular product profitability data for our Google Ads, but it took way too much time to import and analyze the data manually.
Because we were dealing with big data analytics in real time, the best solution to do live ad campaign optimization and stay ahead was going to be with automation.
The automated solution: Essentially, we were already very comfortable combining backend profitability data with each transaction. The only missing piece was connecting transactions with a GCLID. Once we had GCLID tracking with transactions, we could now use the data import feature to create a new conversion for profit and import data directly into Google Ads.
Keep in mind: In order to create a custom ROI metric in Google Ads, you have to set up the conversion so that it doesn’t show up in the normal conversion reports, but in the “ALL conversions” report. This allows for more flexibility in measuring profitability within certain reports that do not allow you to use a conversion type segment (i.e. if you take all conversion value and subtract conversion value, you get profit, woop!).
At that point, we were able to focus our work on analysis and optimization, because the time-consuming manual work of importing and double-checking the data had been eliminated.
We could now rely on Google Ads for all data required to optimize performance. Instead of having to build custom reports for device / keyword / search query / product, we could use the standard reports within Google Ads as profit data was now baked into the standard reporting.
We could even look into additional segments such as geography, time of day, audiences, demographics and more! We had time to make adjustments based on these data points rather than be buried by analysis.
Now that we had collected enough data, we were able to take advantage of all of our traditional optimization efforts and optimize keyword, device, demographic and audience bids.
All in all, we were more confident in our decisions and were able to evaluate results on the fly to move more quickly and decrease CPC within ineffective segments. That resulted in a more cost-effective performance across the account. Where product-specific performance in shopping campaigns was more challenging in the past, now we had our “North Star” to help drive results and ensure they continued moving in the right direction.
It worked! We were now able to continue optimizing their campaigns as any shifts in the profit and margins of their products happened, since we linked that data between Google Ads and their backend data.
Impact: More Transactions and More Profit Thanks to Finding Best Products to Scale with Data Analysis
This work allowed us to automate what took a lot of time. We could use historical data to influence new strategies while being confident they held true in the present because we had the live ROI data attached.
From experience, we know that eCommerce seasonality is something to look at with PPC. The additional time we had and the confidence in our data allowed us to focus on a new tactic to take advantage of seasonality data.
Even though the ROAS data of the past wasn’t necessarily indicative of profitability, we could still use it as a directional indicator. In this case, we looked at the past 2 years to see if there were certain products that showed an increase in efficiency (ROAS) AND revenue / transaction volume to make sure they were maximizing that traffic this year.
The difference this year is that we were confident in investing more in these campaigns. We knew we’d have profitability data and could adjust more on the fly if needed. After comparing the holiday season vs the pre-holiday period, we isolated 30-40 products that showed a big increase in performance and conversion rates.
Since these products consistently did better historically, we grouped them together to bid more aggressively on them during the holiday season. This optimization led to more traffic, more conversions, and a higher ROI.
While costs went up slightly, the increase in transactions far outpaced the increase in cost year over year:
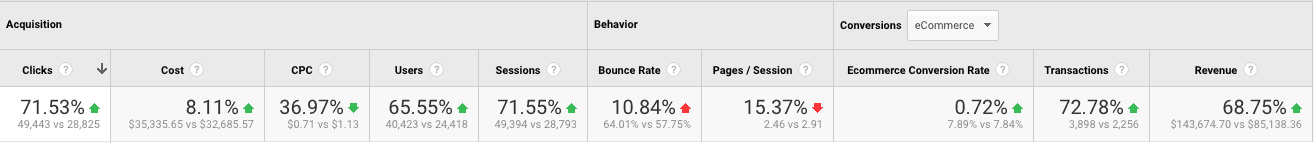
This chart compares cost and revenue Sep – Dec 2019 vs Sep – Dec 2018:

The official tracking implementation went into place mid July and July – October was a particular focus in collecting data and optimizing bids. Things remain fairly consistent Y/Y until we hit early November, where you start to see the transactions significantly outpace the year prior thanks to the data analysis and optimizations to the PPC campaigns.
You don’t always see immediate results from data driven optimization, but there is a clear landmark for when results really take off. In this case, it looks to correlate to when we were able to do a lot of the heavier lifting on the optimization front.
Anytime you can both increase spend and ROAS, that’s a huge win. We also see the increased efficiency of the PPC campaigns here as the ROAS also outpaces the year prior (with a higher level of spend).
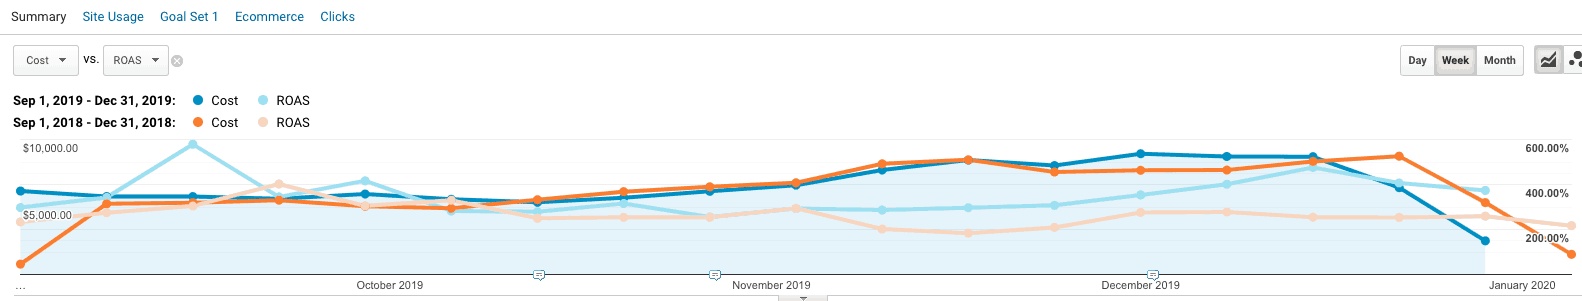
The chart below shows “Cost” in blue vs ROI (profit / cost) in red. If we’re hitting 1 (100%) we’re at break even vs ad spend and anything above 100% is pure profit. Even though we’re more confident with better ROI data, it’s still helpful to cross check with GA ROAS data.
In this case, we’re seeing costs increase, with higher transaction volume, increased ROAS (screenshot above) and improved ROI (screenshot below): a win-win scenario.
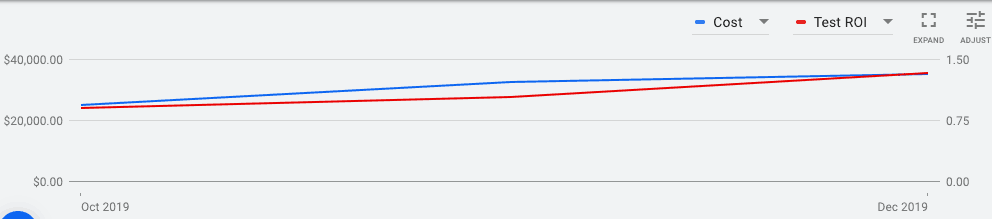
The blue line represents ad spend while the red line represents the ROI. Both ad spend and ROI have increased since October 2019 thanks to the data analysis we performed in order to maximize profitability.
Takeaways
So, what should eCommerce businesses take away from this case study?
- Data driven PPC requires multiple layers of data collected to analyze and identify the best approach. We cannot overstate how much we enjoy working with clients who have such in depth data and knowledge of their business.
- While instant results from PPC do happen, it’s not necessarily the norm. There are unique challenges to every business that determine how to make the platform work for your business and what you need. Collecting the data is crucial, but the analysis process to that data is not “plug and play.”
- In this case, the longer process was understanding how to marry the client’s business metrics with the appropriate Google Ads capabilities. Then, to use that integration to make us both function based on our strengths.
- The other important idea here is that ROAS is not the KPI that equals profitability. To identify opportunities for profitability you need to combine a strong understanding of business KPIs with a strong understanding of Ads Strategy & Tracking capabilities. Good decisions will follow.
In this case, we were also able to build in assisted transactions reporting into Google Ads, a unique Google Ads / Google Analytics implementation we took advantage of. Ask us how we did it, it’s pretty cool…and nerdy.
Note: Do you want some help identifying opportunities to maximize profitability through PPC, SEO, or conversion optimization with your data? Our eCommerce marketing experts can help! Get in touch.
 from Inflow https://ift.tt/3br56OX via IFTTT


No comments:
Post a Comment